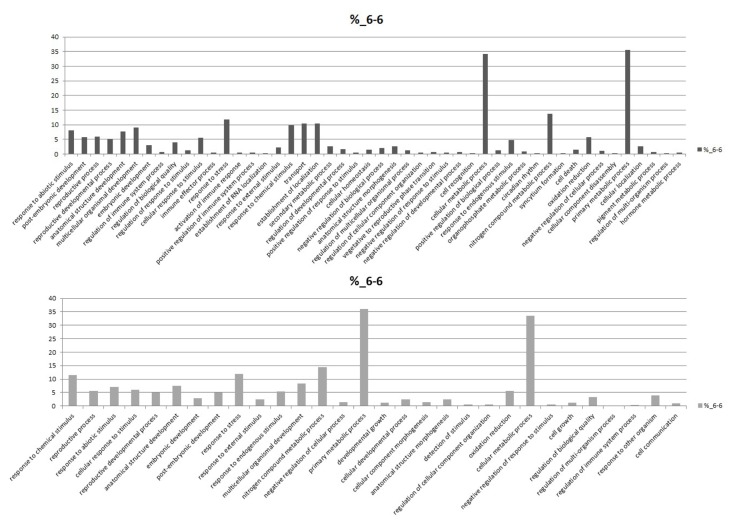
Figure 7. GO functional classification of two different samples.
GO functional classification analysis of differentially expressed genes between J-13 and Lu-6 after 6 days of drought treatment. Histograms represent the functional distribution, which is expressed as a percentage of the amount of genes.

