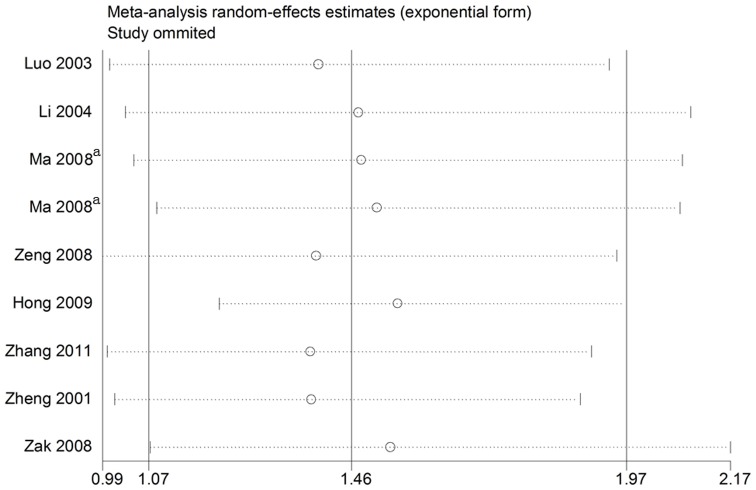
Figure 5. Analysis of the influence of individual studies on the pooled estimate in the dominant model (TT + GT vs. GG) of the SELE gene G98T polymorphism.
Open circles indicate the pooled OR, given the named study is omitted. Horizontal lines represent the 95% CIs. aOne study with different types of populations.

