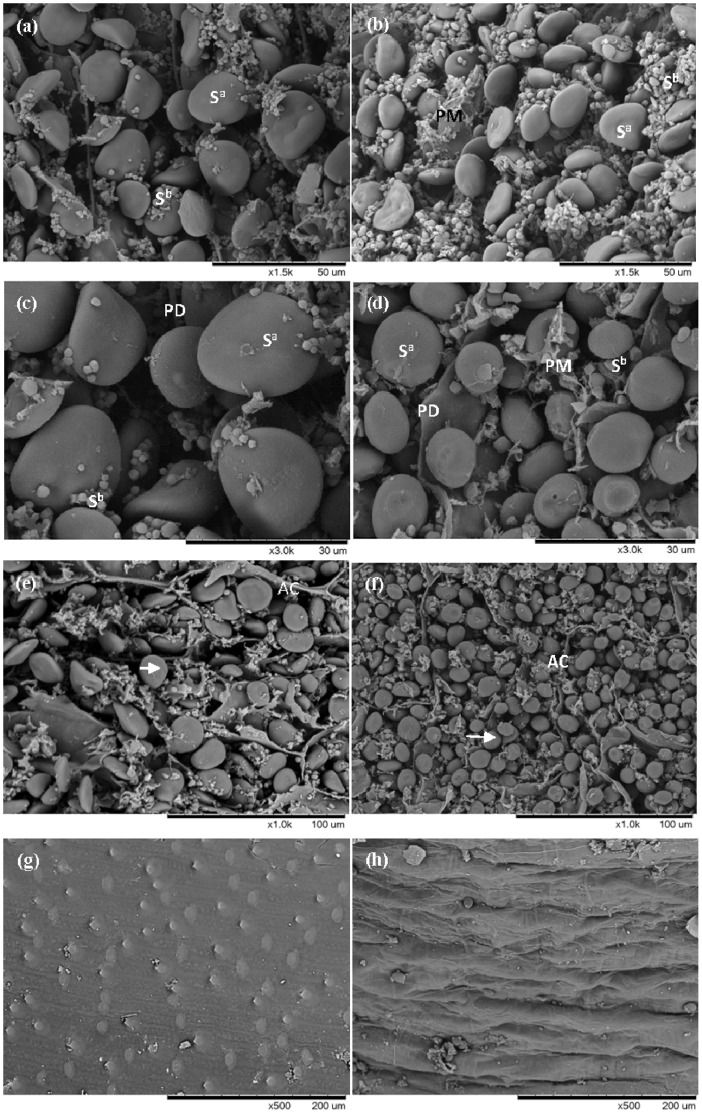
Figure 3. Scanning electron microscopy (SEM) image of matured grains in two barley genotypes W6nk2 (left panel) and Zhenong8 (right panel).
Photo is representative from six different experiments. Figure 3 (a)–(d), SEM image illustrating the starch–protein interface in Zhenong8 (b, d) compared with that exhibited by W6nk2 (a and c). Note the higher amount of associated protein in a, c, which surrounds the large A-type starch granules (Sa) and engulfs the smaller B-type starch granules (Sb). PD, protein deposits; PM, protein matrix among large and small starch granules. (e) and (f), SEM image of the nature fracture surface of aleurone layer, arrow shows aleurone grain; AC, aleurone cell. (g) and (h), SEM image of the epidermis of grain.

