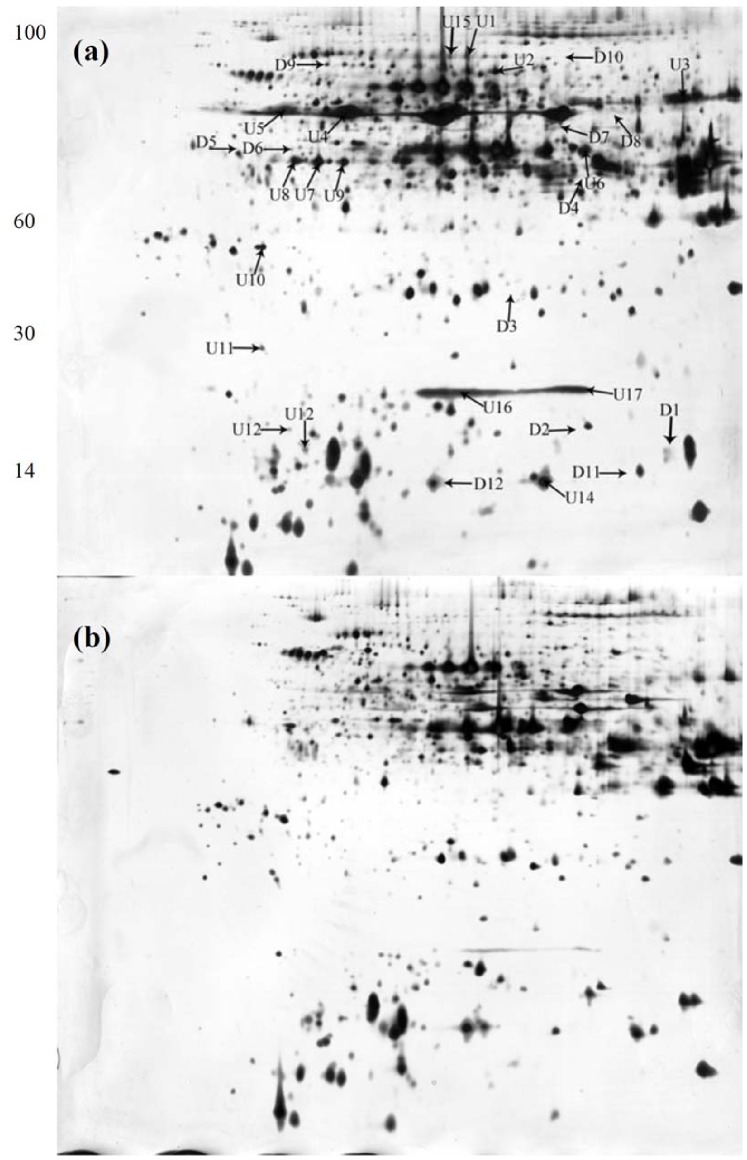
Figure 5. Representative 2-DE maps comparing two grain proteins of Zhenong8 (a) and W6nk2 (b).
Total grain proteins were extracted and separated by 2-DE. In IEF, 90 µg of proteins were loaded onto pH 4–7 IPG strips (24 cm, linear). SDS-PAGE was performed with 12.5% gels. The spots were visualized by silver staining. Differentially accumulated protein spots are indicated by arrowheads. Seventeen higher expressed spots (U1∼U17) and 12 suppressed spots (D1∼D12) are indicated on the map of high-grain-Cd-accumulate genotype Zhenong8 (Zhenong8 vs W6nk2).

