
Figure 4. The number of distinct ingredients discovered vs. the number of recipes scanned.
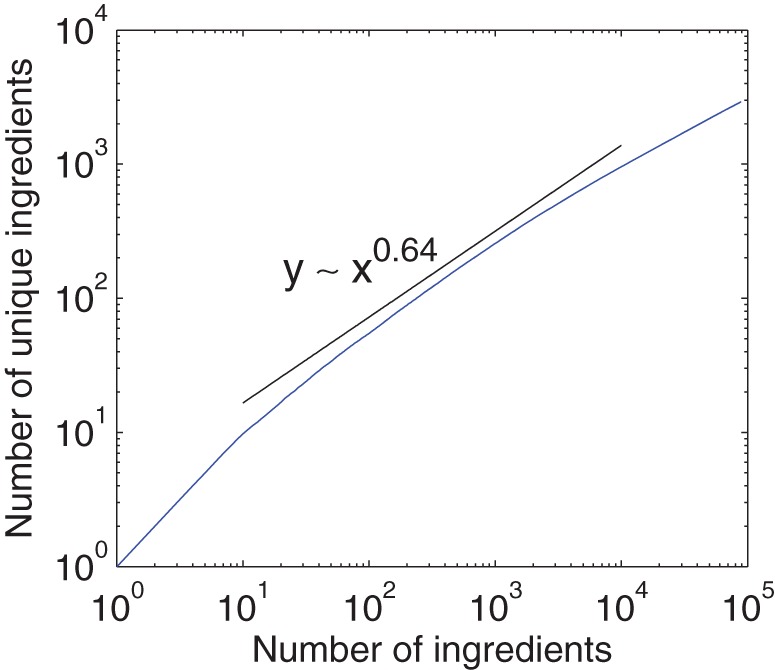
The plot (blue curve) approximately follows Heap's law (black guideline). The graph is obtained by averaging  implementations with independently random sequences of recipes.