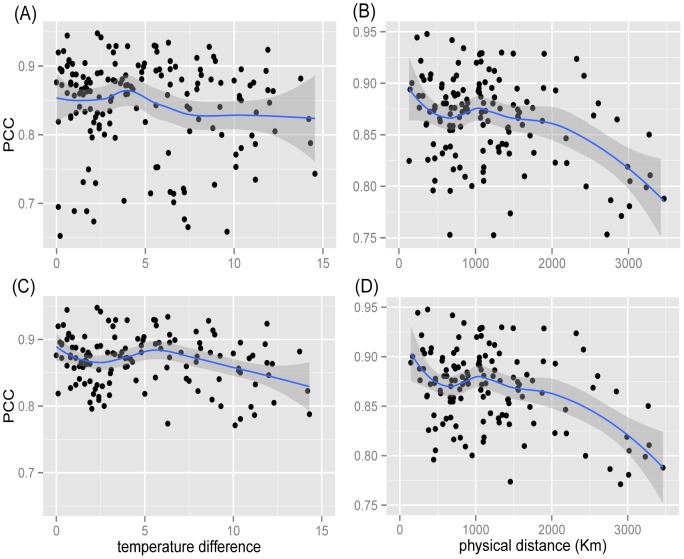
Figure 8. The dependence of similarities between different regional cuisines on the climate and geography.
(A): scatter plot of PCC and temperature difference (all regional cuisine pairs); (B): scatter plot of PCC and physical distance (all regional cuisine pairs); (C): scatter plot of PCC and temperature difference (neglecting outliers); (D): scatter plot of PCC and temperature difference (neglecting outliers).

