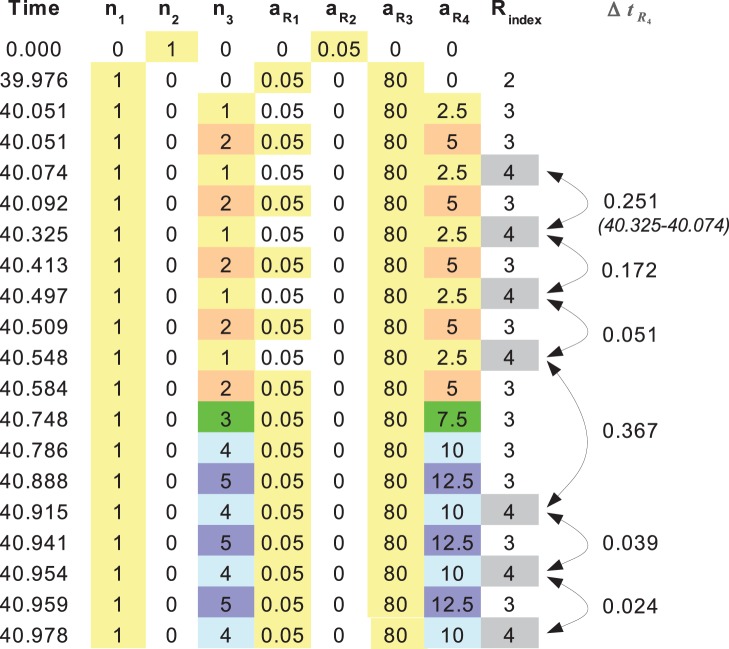
Figure 1. StochPy simulation output.
An example of explicit simulation output of StochPy is shown in a table. It reports the number of molecules of each molecular species and the reaction propensities at each time point when a reaction occurs. The time differences between consecutive rows indicate waiting times between reaction events. In the last column, the waiting times for reaction 4,  , are given and they correspond to the time period between consecutive instances of activity of reaction 4.

