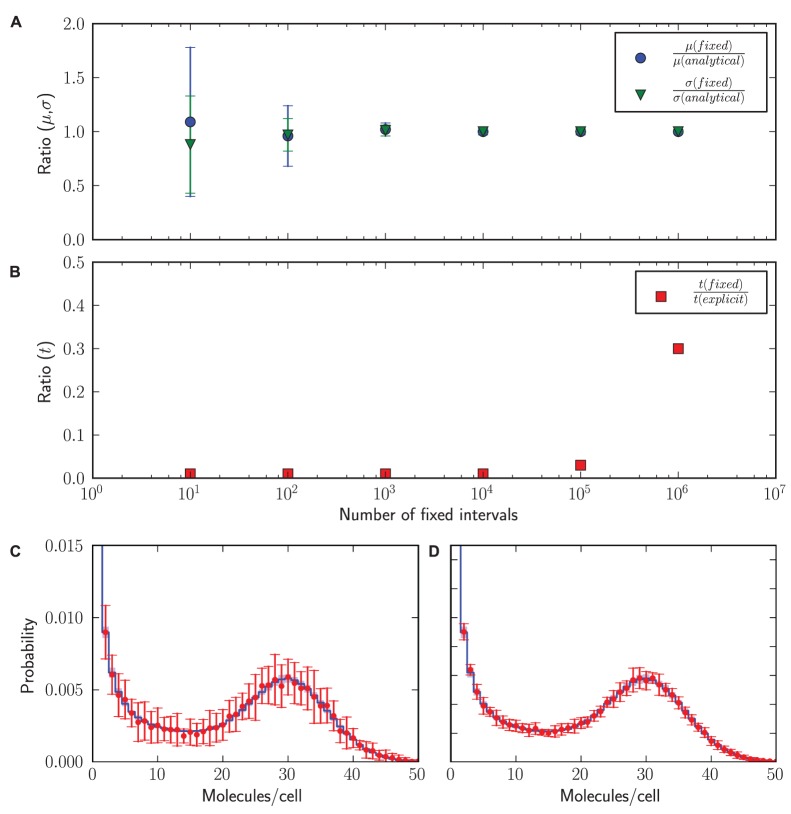
Figure 2. Fixed interval versus explicit simulation output.
Hundred stochastic simulations until t = 60.000 min ( time steps) were done with
  min−1,
  min−1,
  min−1, and
  min−1. (A) Accuracy of mean and standard deviation estimates as function of the number of fixed intervals. (B) Simulation time with fixed-interval output increases with the number of fixed intervals. Fixed-interval simulations were done with the StochPy interface to StochKit2 and include the time to calculate the associated probability distributions. (C) The stationary mRNA distribution for
  fixed intervals (red error bars, 1.96
  ) vs. explicit output (blue 95% confidence interval). Note that 1.96
  corresponds to a 95% confidence interval. (D) The stationary mRNA distribution for
  fixed intervals (red error bars, 1.96
  ) vs. explicit output (blue 95% confidence interval).

