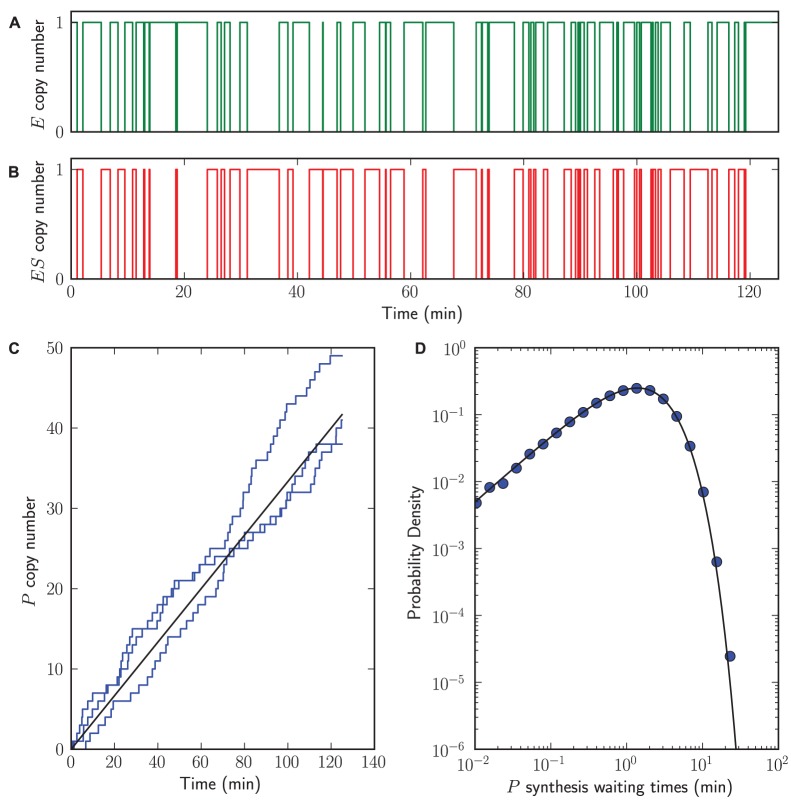
Figure 6. Single-molecule enzymology.
StochPy plots for single-molecule enzyme activity simulations with StochPy simulations (step, markers, blue) and analytical solutions (solid, black) (A–B) time-series data of  and
and  ,
,  . (C) three time trajectories that fluctuate around the analytical solution. This analytical solution corresponds to the mean rate of formation, which for stochastic simulations can be obtained by taking the average of many generated time trajectories. (D) event waiting times of product
  formation peak.

