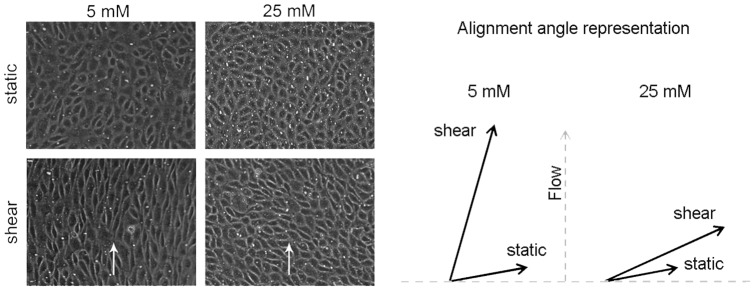
Figure 4. Representative alignment of monolayers cultured in high versus normal glucose subjected to shear stress.

BAEC monolayers were exposed for 24/cm2, by using the 6 shaft apparatus described in the methods. The alignment of monolayers cultured in high glucose was determined by taking 6 random images of each insert (n = 3 inserts) in the near-edge region and measuring the aspect ratio and angle of each cell using the software image J. The aspect ratio and angle of alignment were used as indicators of alignment and were found to be significantly lower in monolayers cultured in high glucose versus monolayers cultured in normal glucose (aspect ratio: 1.98±0.09 vs. 3.61±0.11 and alignment angle: 85.24±1.24 vs. 20.92±0.65). Arrows on the picture indicate the direction of the flow.
