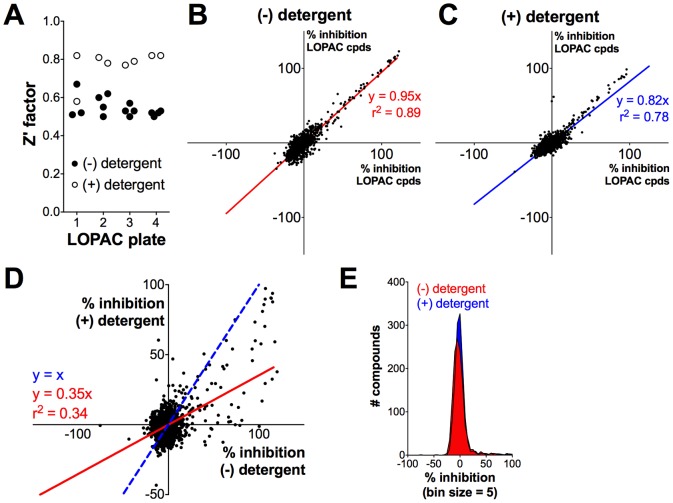
Figure 3. Assay validation using the LOPAC ± detergent.
(A) Z' factors for replicate LOPAC experiments ± detergent. (B–C) Comparison of duplicate runs of the LOPAC ± detergent. Each point represents the activity of a discrete compound from the LOPAC. (D) Comparison of the LOPAC results ± detergent. Percent inhibitions represent the means of the replicate LOPAC experiments. Trend line (solid, red), ideal correlation line (dashed, blue). (E) Percent inhibition distribution of the averaged LOPAC results ± detergent, binned in 5% intervals.

