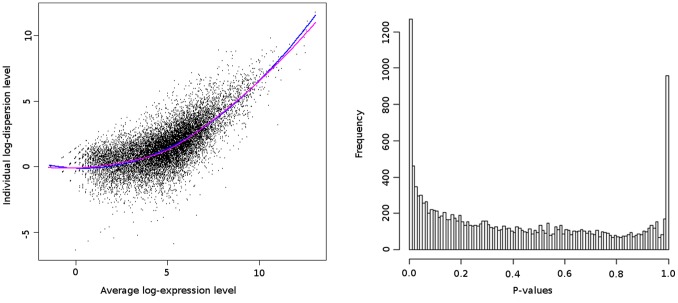
Figure 2. Left: Local estimation of dispersion.
Dispersion parameter estimates  as a function of the mean expression
  (log-scale). Each point corresponds to a gene. The purple and blue curves represent the Loess and Quadratic Regression estimates, respectively. Right: Histogram of the p-values for the G vs M comparison.

