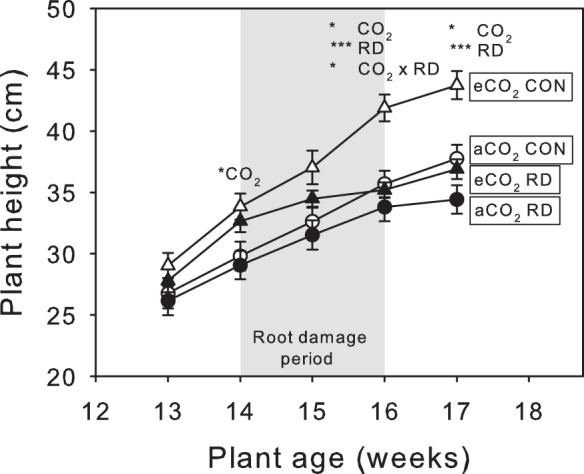
Figure 1. Plant height as affected by root damage and CO2.

Height immediately preceding, during (shaded grey) and after root damage (RD) on plants under aCO2 (circles) and eCO2 (triangles). Open symbols are control plants (CON), closed symbols are plants with insect root damage (RD). Mean values ± S.E. shown, N = 24. Statistical significance of treatments indicated *(P<0.05), **(P<0.01) and *** (P<0.001).
