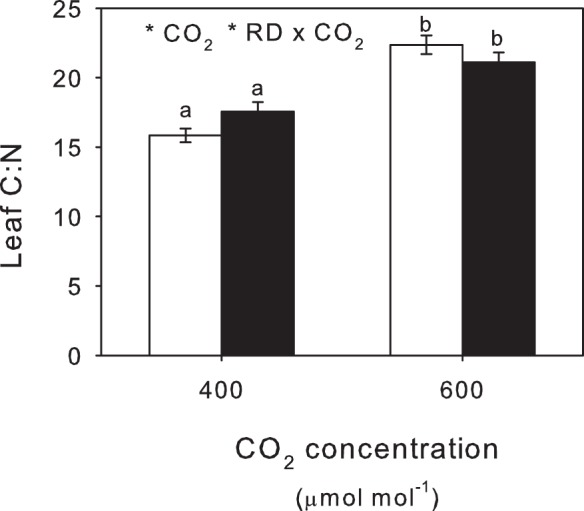
Figure 4. Leaf C:N ratios. Effects of aCO2 and eCO2 on leaf C:N from plants without (open bars)and with root damage (RD).

Mean values ± S.E. shown, N = 24. Statistical significance of treatments indicated *(P<0.05) with lowercase superscript letters indicating significant differences (P<0.05) between treatments.
