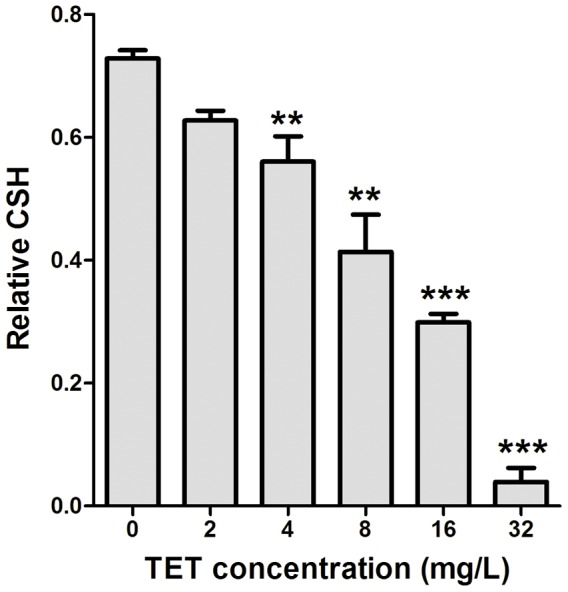
Figure 4. Effects of different concentrations of TET on CSH of C. albicans SC5314.

CSH was estimated by using the water-hydrocarbon two-phase assay. Standard deviations are depicted and based on three independent experiments. ** P<0.01, *** P<0.001.

CSH was estimated by using the water-hydrocarbon two-phase assay. Standard deviations are depicted and based on three independent experiments. ** P<0.01, *** P<0.001.