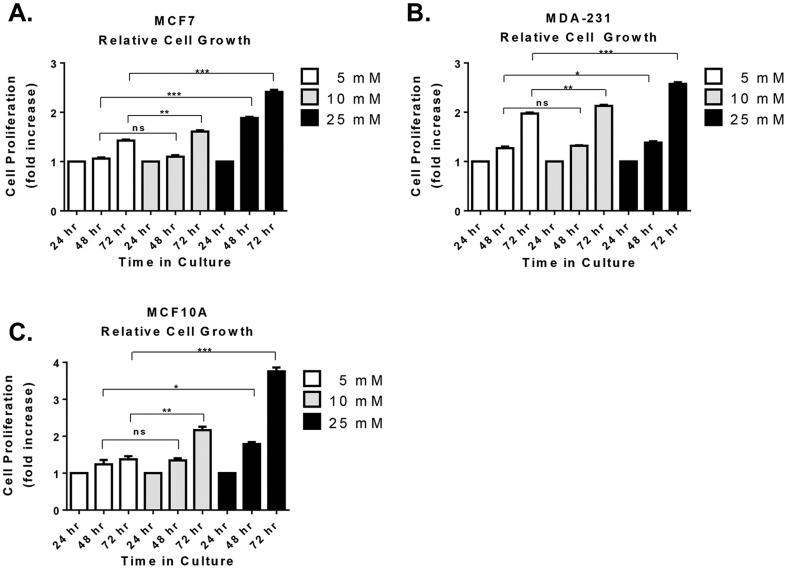
Figure 1. Cell proliferation under hyperglycemia.
Cells were cultured in three concentrations of glucose including 5(normal) and 10 and 25 mM (high glucose). Changes in cell proliferation were assessed via MTS assay at 24, 48, and 72 hr in estrogen-receptor positive breast cancer cells (A), triple negative breast cancer cells (B), and non-tumorigenic breast epithelial cells (C). In each case, results were first normalized to baseline growth at 24 hr for each condition and expressed as fold change in cell proliferation above the 24 hr baseline. Results shown here are representative of at least five separate experiments. Statistical significance was calculated using unpaired Student's t-test. Results are expressed as mean±SEM. ns, not statistically significant *, p-value≤0.05 **, p-value≤0.01 ***, p-value≤0.001.

