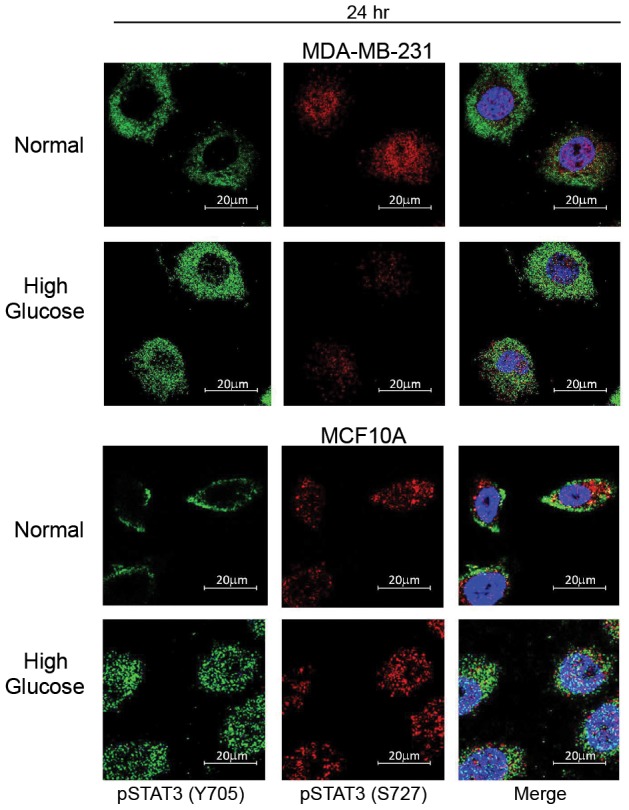
Figure 7. Localization of active STAT3.

MDA-231 cells and MCF10A cells were cultured in normal (5 mM) or high glucose (10 mM) for 24 hr. The levels and cellular localization of active STAT3 phosphorylated at two distinct sites were then assessed via immunofluorescence staining. Levels of STAT3 phosphorylated at tyrosine 705 are shown in the left panel (green) and levels of STAT3 phosphorylated at serine 727 are shown in the middle panel (red). The two images were then merged with DAPI to distinguish cytosolic and nuclear distribution.
