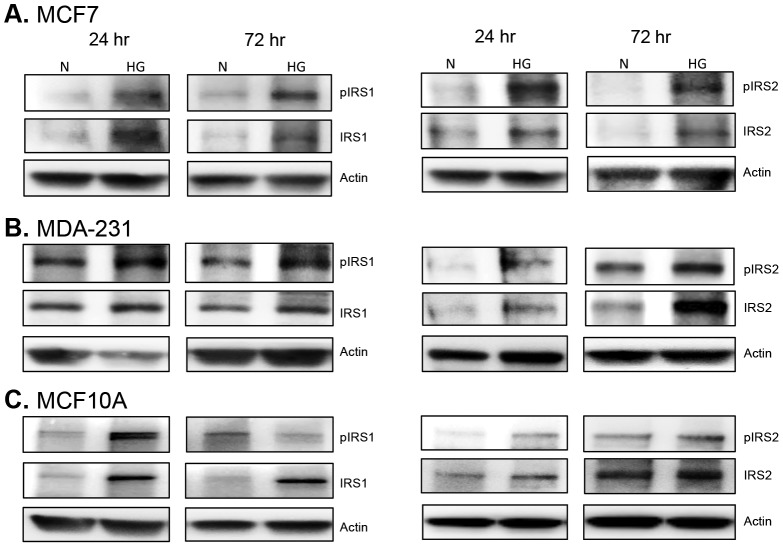
Figure 9. Expression and activation of IRS1/IRS2.
MCF7 (A), MDA-231 (B), and MCF10A cells (C) were cultured in 5 mM (N) or 10 mM glucose (HG). After 24 and 72 hr, cells were harvested and whole cell lysates were subjected to Western blot analysis for IRS1 (left panel) and IRS2 (right panel). A total of 10 µg of protein was loaded per sample and results shown are representative of three replicate experiments.

