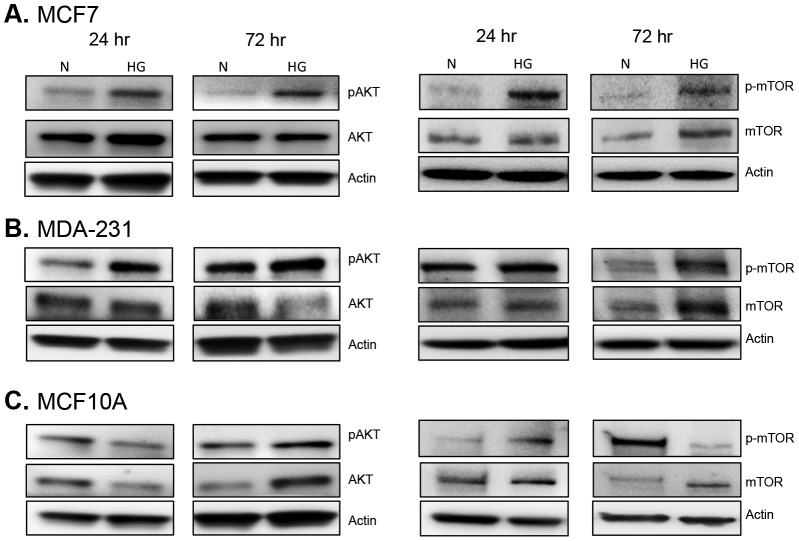
Figure 10. Expression and activation of AKT and mTOR.
Changes in the phosphorylated and total form of AKT (left panel) and mTOR (right panel) were assessed via Western blot in estrogen-receptor positive MCF7 cells (A), triple-negative MDA-231 cells (B), and non-tumorigenic MCF10A cells (C) exposed to either normal (5 mM) or high glucose (10 mM) levels. Twenty micrograms of total protein was loaded for each sample and changes in protein levels were determined at 24 hr and 72 hr. Results are representative of at least three separate experiments.

