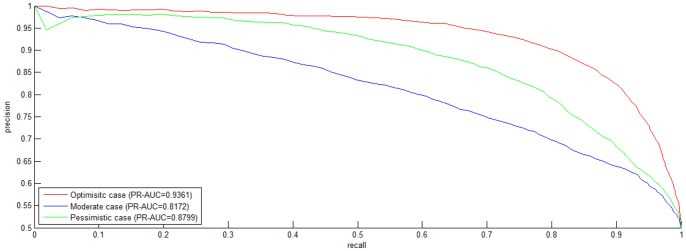
Figure 2. Precision-Recall (PR) curve on S1 dataset.

The negative data is constructed by the negative data sampling method of exclusiveness of subcellular co-localized proteins. The PR curves in red, blue and green indicate the performance for the Optimistic case, the Moderate case and the Pessimistic case, respectively.
