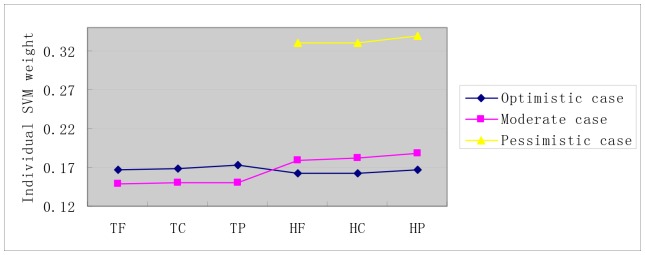
Figure 6. Individual SVM weight distribution on S2 dataset.

The negative data is constructed by by the negative data sampling method of random sampling. The horizontal axis is the combination of two sets {T, H} and {F,C, P}. T denotes the target protein, H denotes the homolog protein; F denotes molecular function, C denotes cellular component and P denotes biological process.
