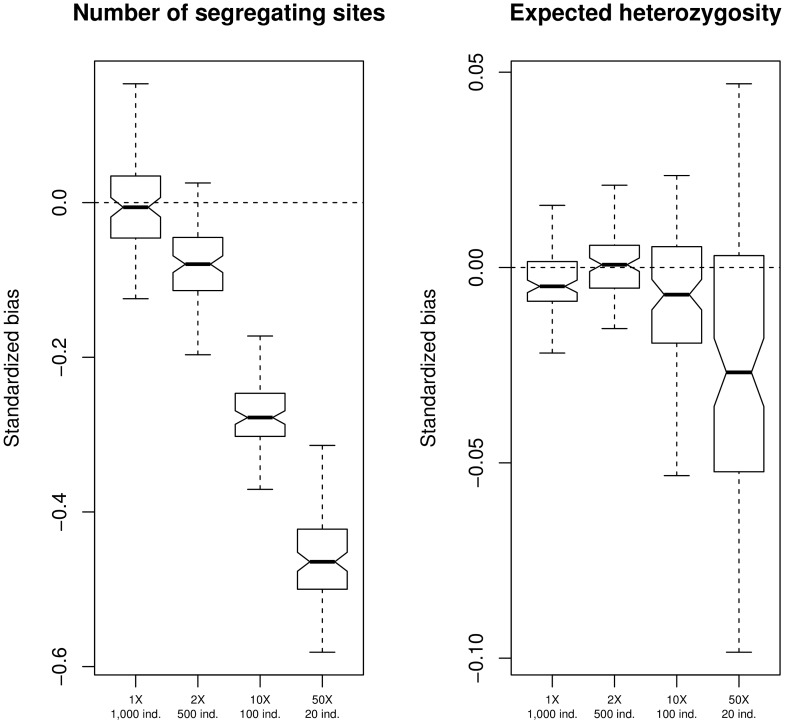
Figure 1. Nucleotide diversity estimation.
Bias in the estimate of the number of segregating sites (left panel) and the expected heterozygosity (right panel) under different experimental scenarios. Sequencing depths are  ,
,  ,
,  , and
, and  and the corresponding sample sizes are
  ,
,  ,
,  , and
, and  individuals. I simulated 100 regions of
  independent sites, with a probability of each site being variable in the population equal to 0.1.

