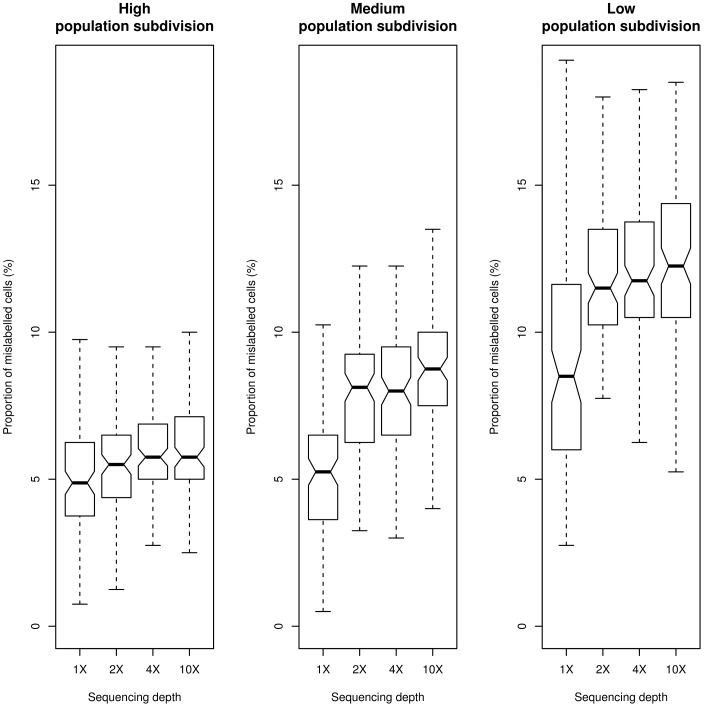
Figure 3. Population structure inference accuracy.
Accuracy of population structure inference, measured as the proportion of cells over a  grid where sub-populations have been wrongly assigned from sequencing data compared to the case of known genotypes for all individuals (see Methods). Sequencing depths are
  ,
,  ,
,  , and
, and  and the corresponding sample sizes are
  , 60, 12, and 6 individuals. I simulated
  independent sites, with a probability of each site being variable in the population equal to 0.1. Populations were simulated with high genetic subdivision (left panel,
  0.4 and 0.1), medium genetic subdivision (mid panel,
  0.3 and 0.05), low genetic subdivision (right panel,
  0.1 and 0.02).

