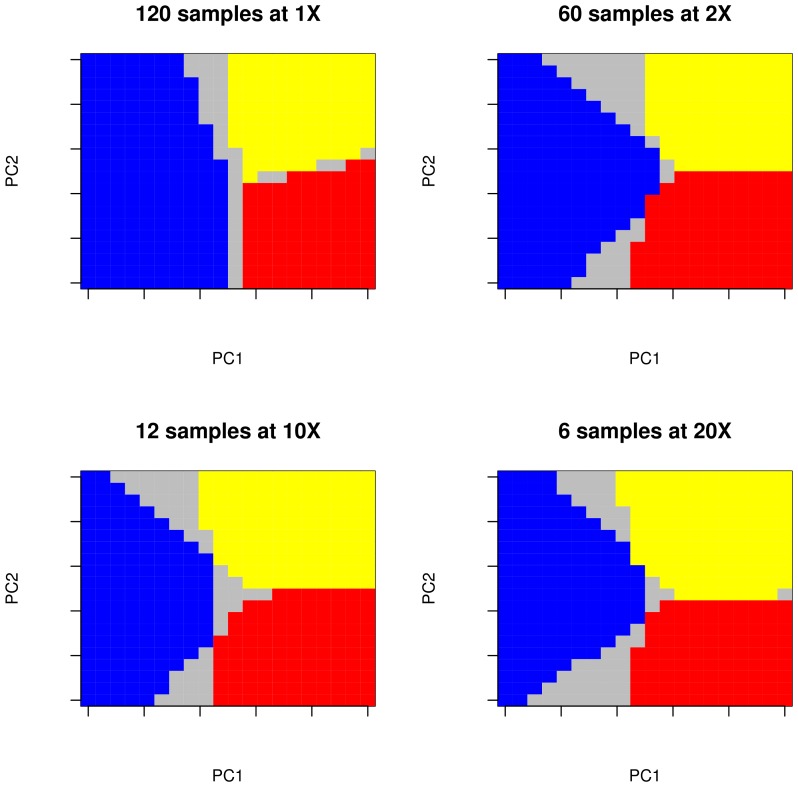
Figure 4. Population structure prediction.
Population structure predicted over a  grid for a single replicate under different experimental scenarios. Simulations were performed as described in Figure 3, in the case of low genetic subdivision. Grey cells represent locations where a different sub-population was predicted to be located from sequencing data compared to the case of known genotypes of all individuals. These particular replicates show a proportion of mislabelled cells equal to be the medium of the distribution. Note that replicates are not the same across the different tested scenarios.

