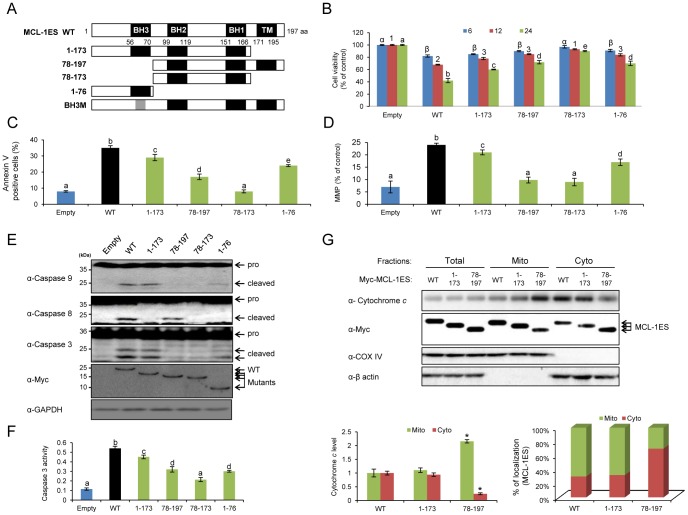
Figure 1. Mapping the MCL-1ES domains crucial for mitochondrial apoptosis.
(A) The MCL-1ES mutants generated are shown. (B) A time course (6, 12, and 24 h) of cell viability of the MCL-1ES mutants in 293T cells is shown after transfecting equal amounts of the respective constructs. (C) Flow cytometry analysis of Annexin V-positive apoptotic cells was performed and (D) MMP of 293T cells was determined 24 h after transfection. Three independent experiments were performed, and the data are expressed as the mean ± SEM. Different letters denote statistically significant different values (P>0.05). (E) The activation of caspases 9, 8, and 3 was assessed by immunoblot analysis using transfected 293T cells. (F) Caspase 3 activity was measured using the DEVD peptide conjugated to p-nitroaniline as described in the Material & Methods. The values are expressed as the mean ± SEM of three replicates. (G) The cytosolic release of cytochrome c was assessed in transfected 293T cells. The cells were separated into mitochondrial and cytosolic fractions. Adequate fractionation was demonstrated by immunoblot analysis using anti-cox IV and anti-β-actin antibodies. The relative cytochrome c level (left graph) was quantified, and MCL-1ES localization (right graph) in the mitochondrial and cytoplasmic fractions was presented (lower panel). The values are expressed as the mean ± SEM of three independent experiments.

