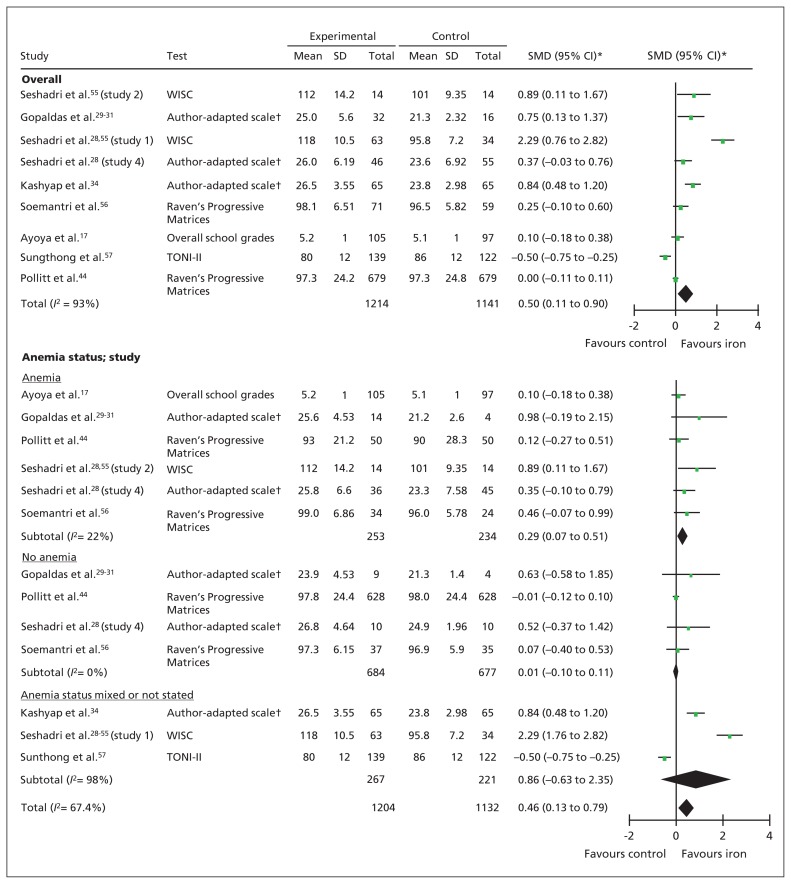
Figure 2:
Forest plots for global cognitive performance and cognitive performance by anemia status. *Inverse variance, random effects. †Author-adapted scales included clerical task test, visual memory test, digit span test and maze test. Note: CI = confidence interval, TONI-II = Test of Non-verbal Intelligence, 2nd edition, SD = standard deviation, SMD = standardized mean difference, WISC = Wechsler Intelligence Scale for Children.

