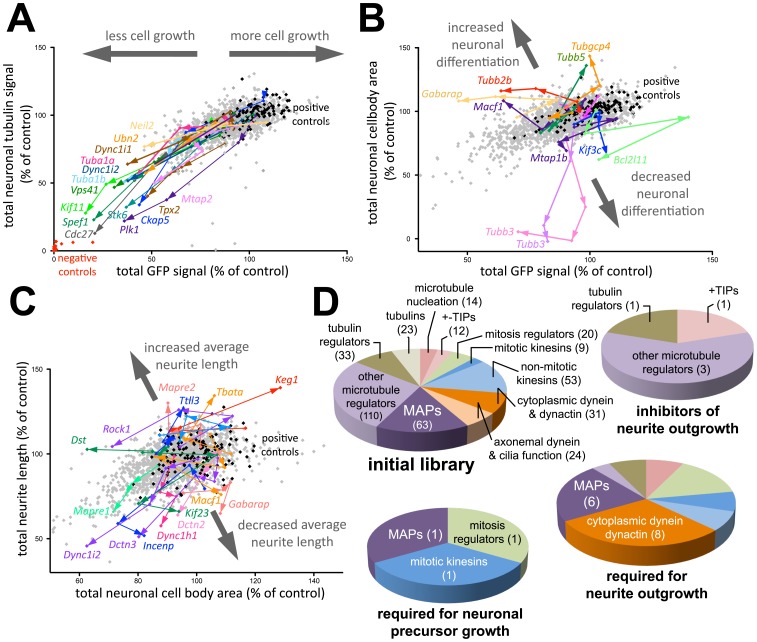
Figure 2. Classification of phenotypes induced by knockdown of microtubule-regulating genes.
Positive controls (differentiated but no siRNA) and negative controls (not differentiated) are indicated by black and red spots, respectively. Titrations of siRNA (0.5–4 pmol/well) targeting microtubule-regulating genes are indicated by arrows pointing toward higher concentrations. Each data point is an average of 3 independent screen repetitions. Grey spots correspond to candidates, which did not induce a strong phenotype. A: Determination of neuronal precursor cell growth by measuring changes in the total EGFP signal. B: Determination of neuronal differentiation by comparing the ratio between the EGFP and total neuronal cell body area relative to positive controls. Thick grey arrows indicate modulation of neuronal differentiation efficiency. C: Measurement of average neurite length by comparing the ratio between total neurite length and neuronal cell body area relative to positive controls. Thick grey arrows indicate modulation of average neurite outgrowth. D: Functional classification of microtubule-regulating genes in the initial library and in three phenotypic hit categories based on stringent selection criteria. Numbers represent the number of genes in each category.

