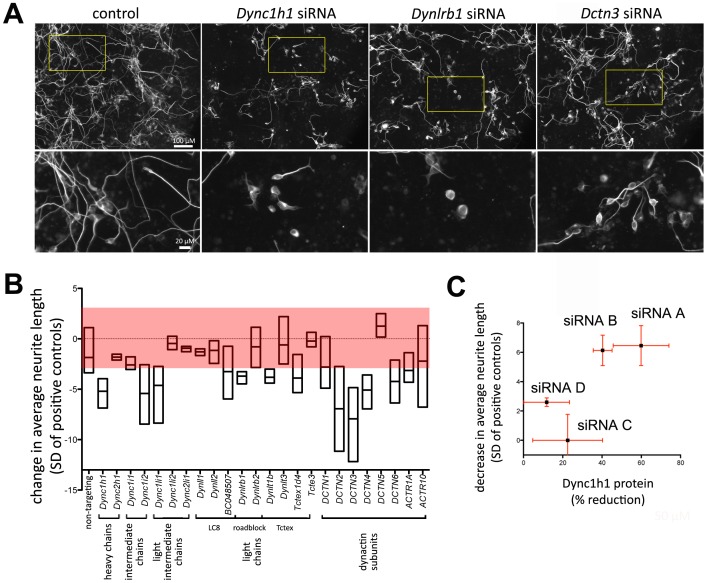
Figure 4. Dynein/Dynactin modulates neurite formation.
A: Representative microscopic images of P19 cells acquired in the primary screen, transfected with neurogenic transcription factor NeuroD2 and 4pmol of siRNA oligonucleotide mixtures targeting Dynein/Dynactin subunits. B: Effect of dynein/dynactin subunit knockdown on average neurite length. The boxed area indicates the ±3 standard deviation threshold for potential candidate identification in the primary screen. C: Plot of the decrease in average neurite length vs the reduction of Dync1h1 protein levels measured via western blot for different siRNAs targeting Dync1h1. Error bars represent the standard error of the mean (n = 3).

