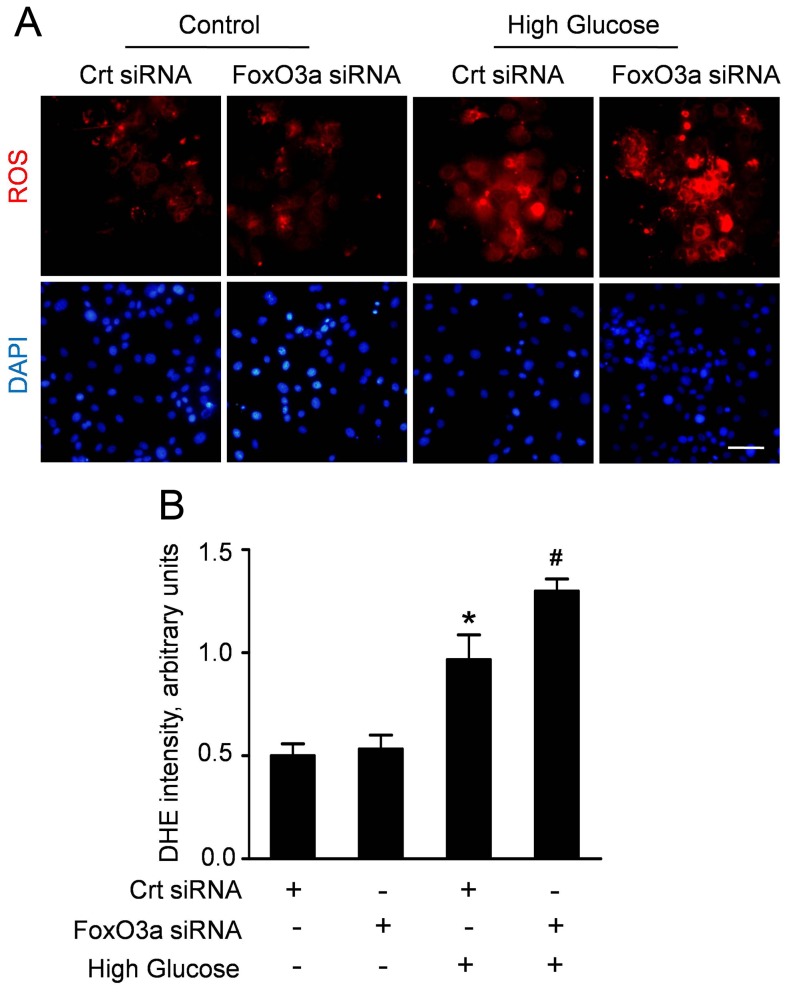
Figure 5. FoxO3a silencing enhanced high glucose-induced ROS production in CMECs.
A: Representative immunofluorescence imagines of ROS formation (red fluorescent) and DAPI (blue fluorescence) in CMECs incubated with FoxO3a siRNA or control siRNA (Crt siRNA) for 24 h. (Scale bars: 50 µm); B: The average fluorescence intensity of DHE in each group. (n = 5, *p<0.05 vs. Crt siRNA plus normal condition, #p<0.05 vs. Crt siRNA plus high glucose).

