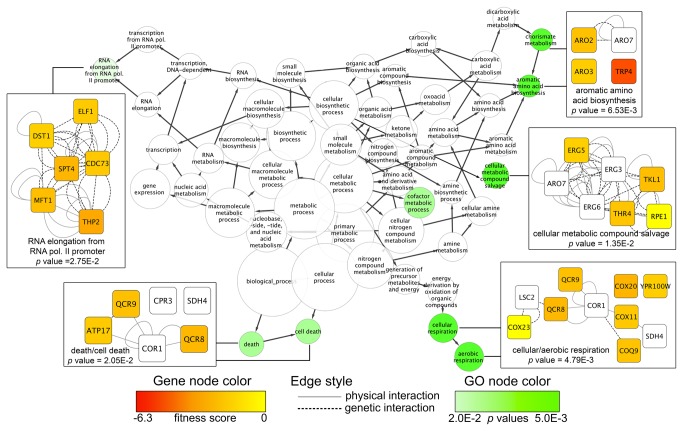
Figure 2. Biological attributes required for toxaphene tolerance are identified by network mapping.
Cytoscape was used to map fitness scores (the ratio of the log2 hybridization signals between DMSO and toxaphene exposures) for toxaphene-sensitive strains onto the Saccharomyces cerevisiae BioGRID interaction dataset. A subnetwork (n = 104) containing genetic and physical interactions between the sensitive, non-sensitive, and essential genes was created and significantly overrepresented (p value cutoff of 0.03) GO categories were identified. The green node color corresponds to the GO p-value while the node size correlates to the number of genes in the category. Edge arrows indicate hierarchy of GO terms. Networks for various GO categories are shown, where node color corresponds to deletion strain fitness score and edge defines the type of interaction between the genes.

