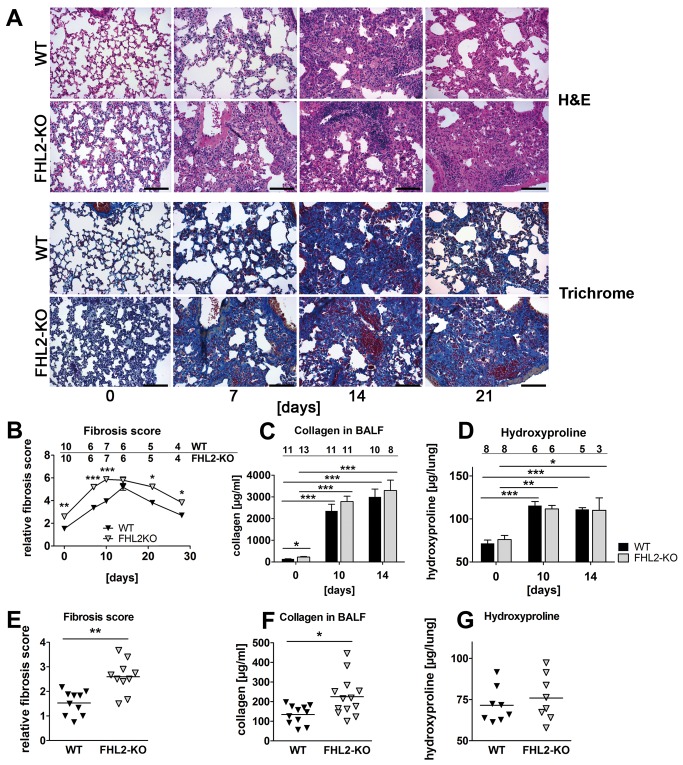
Figure 1. Development of BLM-induced lung fibrosis in FHL2 WT and knockout mice.
(A) FHL2 WT and knockout mice received a single intranasal application of BLM (2 U/kg) and the right lungs were fixed in 4% paraformaldehyde and embedded into paraffin. Four-micrometre-thick sections were stained with hematoxylin and eosin (upper panel) or with AZAN trichrome according to Heidenhain (lower panel). Bar=200 µm. Representative images from N = 2 and n = 5 to 10 (see B) are shown. (B) Lung sections shown in A were scored for fibrotic alterations according to Ashcroft criteria [30] by three observers in a blinded fashion. N = 2. Ciphers above the curves represent the numbers of analysed animals per time point, with upper and lower lines showing WT and FHL2-KO group of mice, respectively. (C and D) Total collagen amount in the bronchoalveolar spaces (C) and hydroxyproline content in lungs (D) of BLM-treated mice. N = 2 – 3, depending on the time point. Ciphers above the curves represent the numbers of analysed animals per group of mice. (E - G) Lung fibrosis score (E), collagen amount in BALF (F) and hydroxyproline content (G) in lungs of non-induced control mice.

