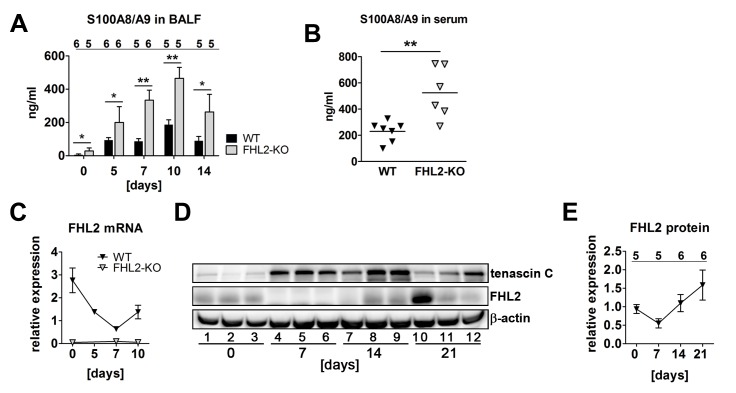
Figure 3. FHL2-deficient mice have a higher inflammation status in the lungs.
(A) The content of the S100A8/A9 soluble proteins was measured in the BALF of mice by ELISA. The number of analysed animals per time point is shown above the columns. (B) Concentration of S100A8/A9 proteins in the serum of control mice measured by ELISA. (C) FHL2 transcripts in the lungs of BLM-treated mice were estimated by TaqMan qRT-PCR. The number of animals analysed per time point varied from 6 to 12. (D) Western blot analysis of FHL2 expression in the lungs of WT mice after BLM-treatment. Representative images of five to six analysed animals per each time point are shown. (E) Quantification of FHL2 WB images. The FHL2 amount was estimated densitometrically as the relative intensity of the FHL2 bands compared to those of the loading controls. Values at time point 0 were taken as unity. N = 2. The number of analysed animals per time point is shown above the curve.

