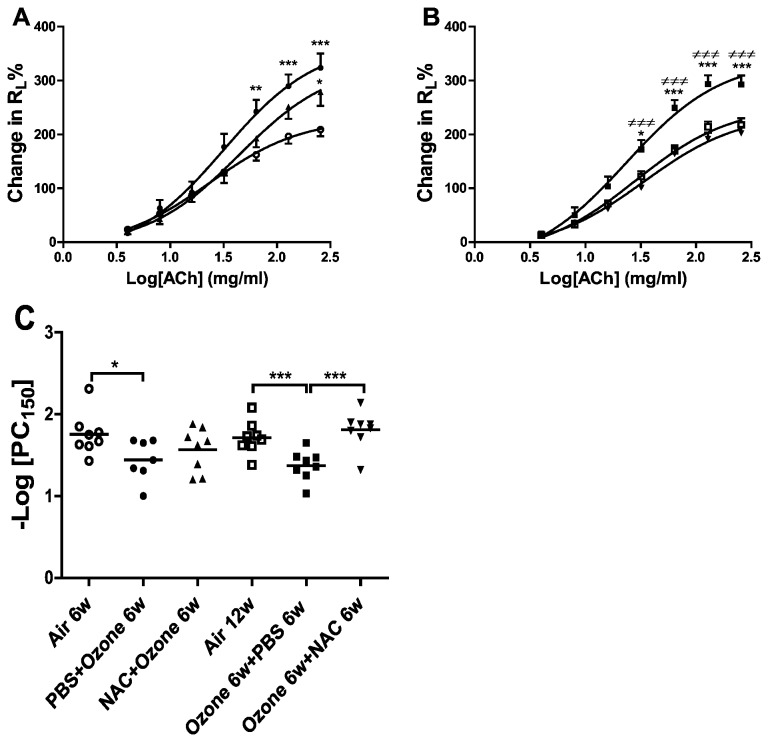
Figure 2. Airway hyperresponsiveness.
Mean percentage increase in lung resistance (RL) to increasing concentrations of acetylcholine is shown in Panel A.. Three groups of mice were studied: air-exposed mice (n=8), PBS-pretreated ozone-exposed mice (n=7), NAC-pretreated ozone-exposed mice (n=8). *P<0.05, **P<0.01, ***P<0.001 compared with air control. Data is expressed as means ±S.E.M. ○: Air exposure 6w,●: ozone-exposure 6w,▲:ozone-exposure and NAC-treatment 6w. Panel B. Mean percentage increase in lung resistance to increasing concentrations of acetylcholine, *P<0.05, **P<0.01, ***P<0.001 compared with air control; ≠P<0.05, ≠≠P<0.01, ≠≠≠P<0.001 compared with ozone-exposed NAC treated group. Data is expressed as means ±S.E.M. □:Air exposure 12w, ■: ozone-exposure 6w and then PBS-treatment 6w,▼: ozone-exposure 6w and then NAC-treatment 6w. Panel C. Individual and mean –log PC150 of the six experimental groups. *P<0.05, **P<0.01.

