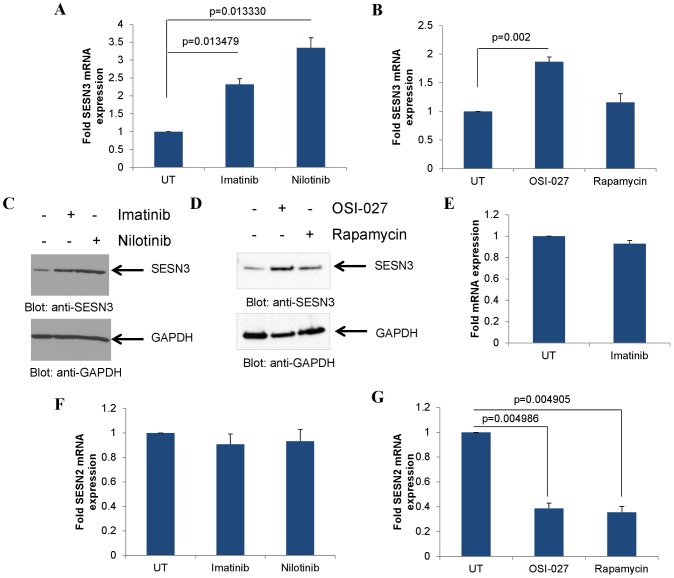
Figure 1. SESN2 and SESN3 expression upon BCR-ABL or mTOR inhibition.
A. KT-1 cells were treated with either imatinib (1 µM) or nilotinib (100 nM) for 12 hours as indicated. RNA was extracted and expression of SESN3 mRNA was determined by quantitative RT-PCR, using GAPDH for normalization. Data are expressed as fold increase in the treated samples over untreated samples and represent means ± S.E. of 3 independent experiments. B. KT-1 cells were treated with either OSI-027 (5 µM) or rapamycin (20 nM) for 12 hours as indicated. RNA was extracted and expression of SESN3 mRNA was determined by quantitative RT-PCR, using GAPDH for normalization. Data are expressed as fold increase in the treated samples over untreated samples and represent means ± S.E. of 4 independent experiments. C. KT-1 cells were treated with imatinib (1 µM) or nilotinib (100 nM) for 24 hours. Total cell lysates were resolved by SDS-PAGE and immunoblotted with antibodies against SESN3 or GAPDH as indicated. D. KT-1 cells were treated with OSI-027 (5 µM) or rapamycin (20 nM) for 16 hours. Total cell lysates were resolved by SDS-PAGE and immunoblotted with antibodies against SESN3 or GAPDH as indicated. E. U937 cells were treated with imatinib (1 µM) for 12 hours. RNA was extracted and expression of SESN3 mRNA was determined by quantitative RT-PCR, using GAPDH for normalization. Data are expressed as fold increase in the treated samples over untreated samples and represent means ± S.E. of 3 independent experiments. F. KT-1 cells were treated with either imatinib (1 µM) or nilotinib (100 nM) for 12 hours. RNA was extracted and expression of SESN2 mRNA was determined by quantitative RT-PCR, using GAPDH for normalization. Data are expressed as fold increase in the treated samples over untreated samples and represent means ± S.E. of 3 independent experiments. G. KT-1 cells were treated with either OSI-027 (5 µM) or rapamycin (20 nM) for 12 hours. RNA was extracted and expression of SESN2 mRNA was determined by quantitative RT-PCR, using GAPDH for normalization. Data are expressed as fold increase in the treated samples over untreated samples and represent means ± S.E. of 3 independent experiments.

