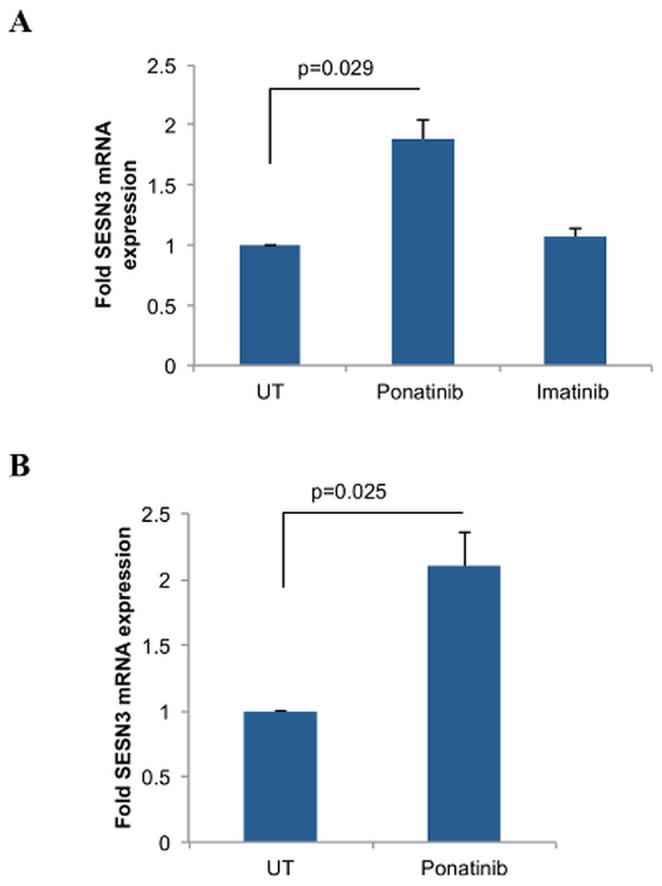
Figure 3. Induction of SESN3 mRNA expression by ponatinib in T315I-BCR-ABL expressing cells.

A. Ba/F3 cells stably transfected with T315I-BCR-ABL were treated with ponatinib (10 nM) or imatinib (1 µM) for 12 hours as indicated. RNA was extracted and expression of SESN3 mRNA was determined by quantitative RT-PCR, using β-actin for normalization. Data are expressed as fold increase in the treated samples over untreated samples and represent means ± S.E. of 3 independent experiments. B. BV173R cells were treated with ponatinib (100 nM) for 12 hours. RNA was extracted and expression of SESN3 mRNA was determined by quantitative RT-PCR, using GAPDH for normalization. Data are expressed as fold increase in the treated samples over untreated samples and represent means ± S.E. of 4 independent experiments.
