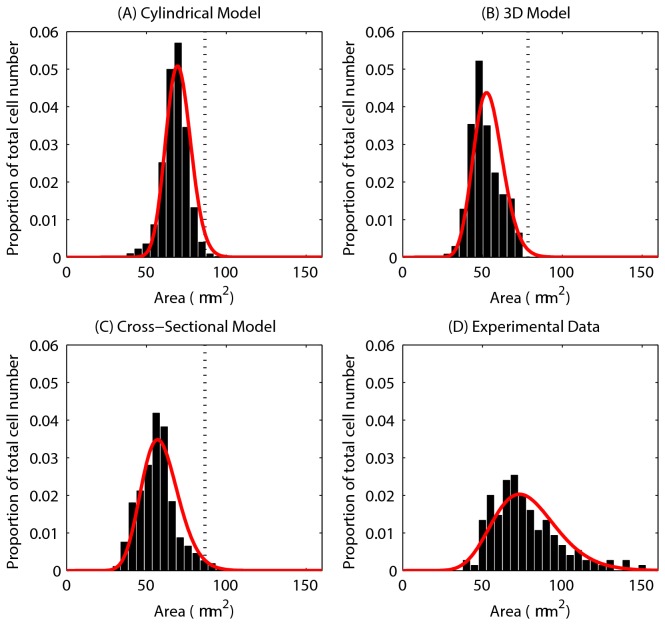
Figure 4. Epithelial cell size for each of the computational models.
(A) - (C) The epithelial cell area distribution for each model – the red curve marks the fitted Gamma distribution in each case. The vertical dotted line marks the equilibrium area (86.6 μm2), and the proportion of the total number of epithelial cells is indicated on the y-axis. (D) Experimental data obtained from three wildtype murine tissue samples, taken from midway down the length of the colon. ((C) and (D) re-plotted from data provided in [34]).

