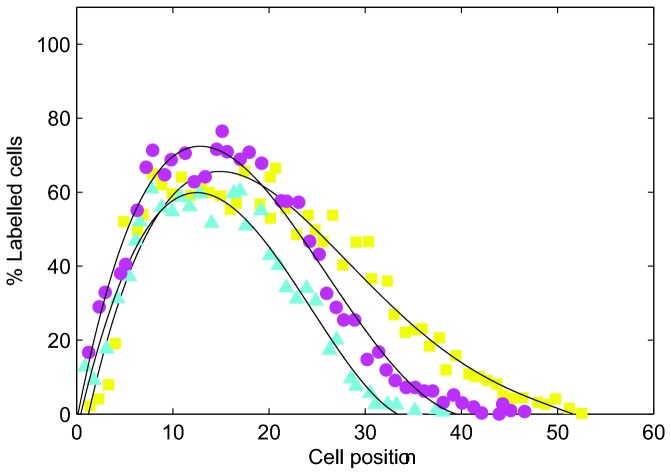
Figure 6. An example of experimental results showing labelled cell distributions at specific time intervals following irradiation.
% Labelling index corresponds to the percentage of labelled cells in the crypt. (●) 9 hours, (▲) 12 hours, (■) 24 hours. Data re-plotted from [41].

