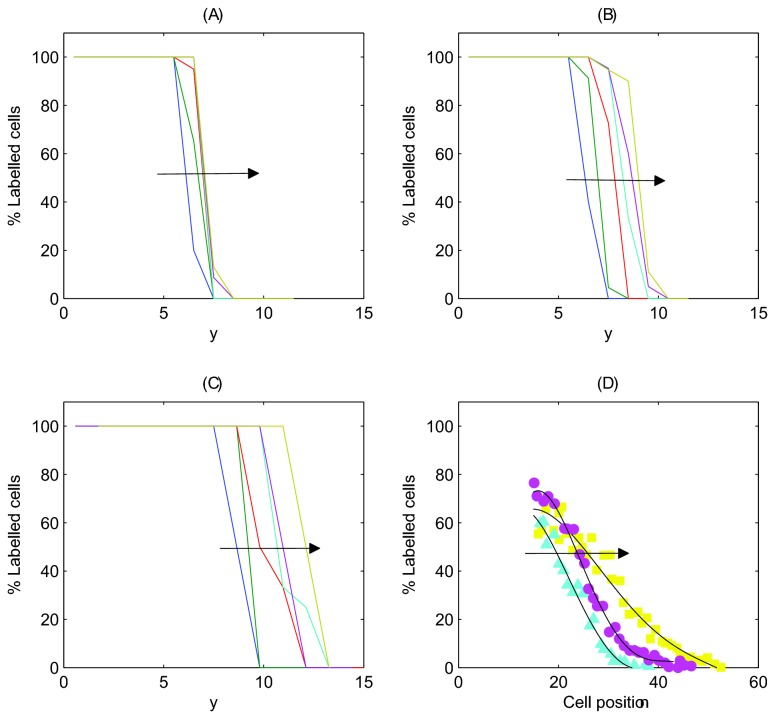
Figure 12. The change in the distribution of labelled cells following the elimination of cell division.
Each curve corresponds to the percentage of labelled cells within horizontal bands of width 1 cell diameters after 1 hour, 3 hours, 6 hours, 9 hours, 12 hours and 24 hours (averaged over 50 simulations in each case). The arrow indicates the movement of the distribution with increasing time. Plot (D) shows the results found by Kaur and Potten for 9, 12 and 24 hours, edited from Figure 6(B) to facilitate comparison with in silico results.

