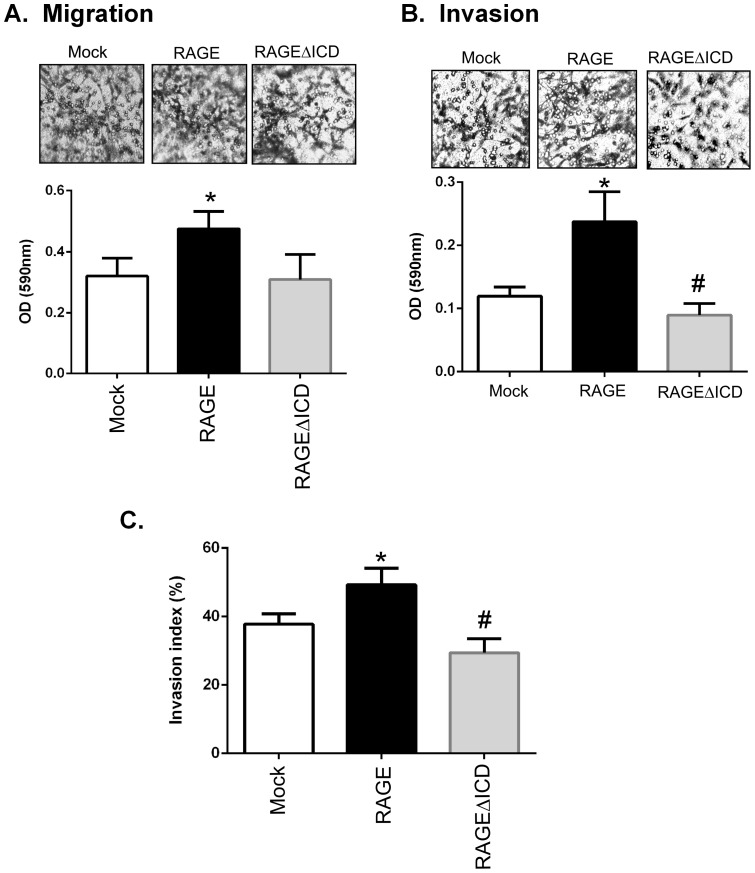
Figure 5. RAGEΔICD affects cellular migration and invasion.
A–C. C6 glioma cells expressing RAGE, RAGEΔICD, or empty vector (mock) were assessed for cell migration (A) and cell invasion (B) using chemotaxis assays. Cells were seeded into the upper chamber of a Boyden transwell filters and allowed to migrate toward 1% FBS stimulant for 24 hours. For invasion assays, transwell filters were coated with 12.5 ug of Matrigel. C. To assess the “invasive index” of cells, the ratio of migrated cells by invaded cells was calculated and expressed as a percentage. Data are means ± SEM from three independent experiments. *, significant differences (P≤0.05) between mock and RAGE, whereas # significant differences (P≤0.05) between RAGE and RAGEΔICD.

