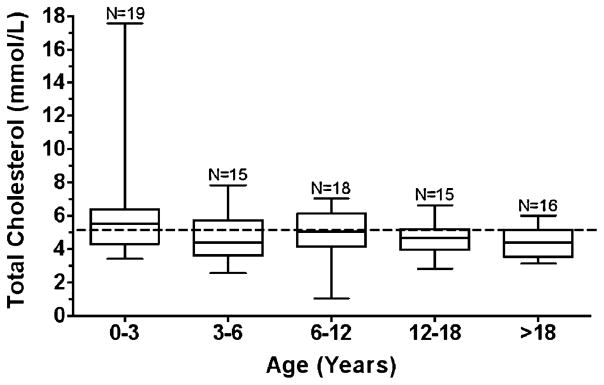
Fig. 2.

Total cholesterol box-and-whisker plot. Boxes represent the 25th to 75th percentiles, and the median is represented in each box. The range of the observations is depicted by the whiskers. The dotted line represents the cut-off for hypercholesterolemia defined as >5.17 mmol/L (200 mg/dl). One observation – the mean of multiple values - per patient was plotted within each age bracket. N=the number of observations within each age bracket
