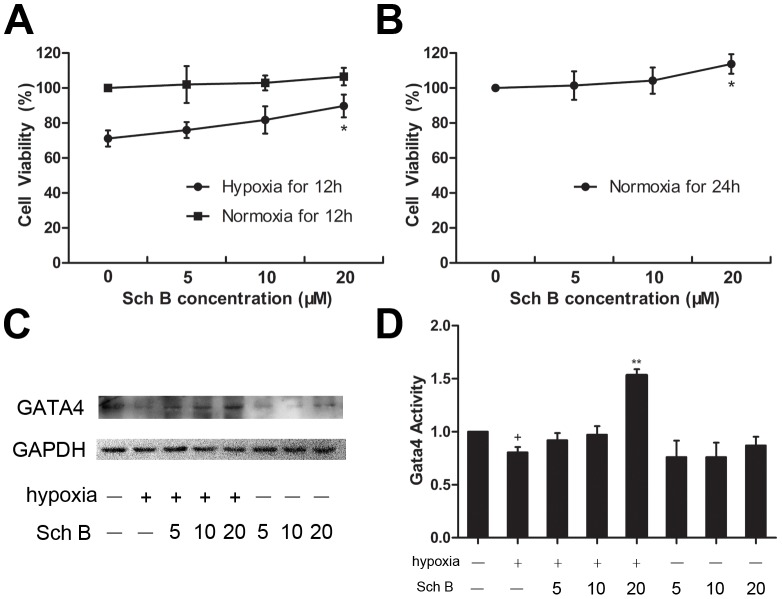
Figure 9. Sch B in the effects of increasing cell viability in H9c2 cells.
(A) Cell viability determined by MTT assay after hypoxic injury or normoxic for 12 hours pre-treatment with Sch B induced concentrations-dependent increases in survival of H9c2 cells. (B) Cell viability determined by MTT assay for 24 hours in normoxia condition pre-treatment with Sch B induced concentrations-dependent increases in survival of H9c2 cells. n = 6 per group, *P<0.05 versus 0 µM Sch B group. (C) Western blot analysis of GATA4. (D) Densitometry for GATA4 expression normalized to GAPDH. n = 3 per group, *P<0.05 versus hypoxia (+) and Sch (−) group, **P<0.01 versus hypoxia (+) and Sch (−) group, +P<0.05 versus hypoxia (−) and Sch (−) group, ++P<0.01 versus hypoxia (−) and Sch (−) group.

