
Figure 4. Expression of CYP1A1 (right) and CYP1B1 (left) genes in HepG2 and A549 cells exposed to increasing concentrations of B[a]P from 0.2 to 5 µM for 14 h.
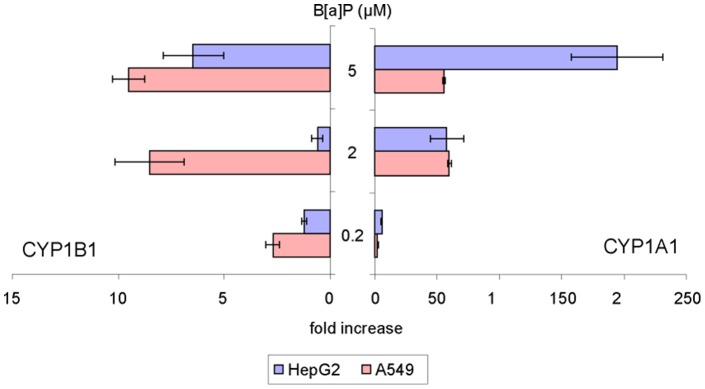
Differences with respect to DMSO control were found statistically significant for both genes in both cell lines at all concentrations (p<0.05) except CYP1B1 in HepG2 at 0.2 and 2 µM B[a]P.