
Figure 6. Induction of CYP1A1 and 1B1 in A549 and HepG2 cells exposed to 0.2 µM B[a]P.
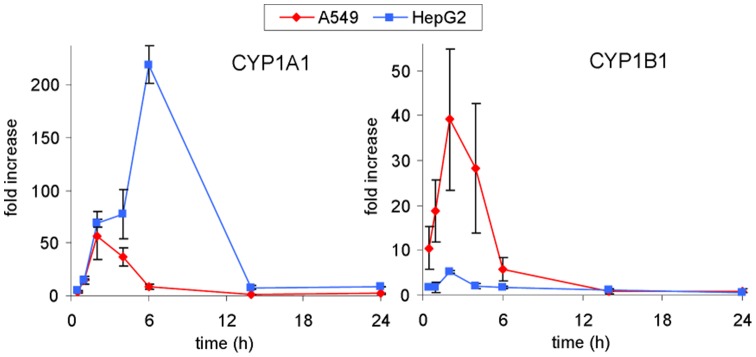
Data were found significantly different (p<0.05) with respect to DMSO control for both cell lines between 30 min and 6 h.
Official websites use .gov
A
.gov website belongs to an official
government organization in the United States.
Secure .gov websites use HTTPS
A lock (
) or https:// means you've safely
connected to the .gov website. Share sensitive
information only on official, secure websites.
Data were found significantly different (p<0.05) with respect to DMSO control for both cell lines between 30 min and 6 h.