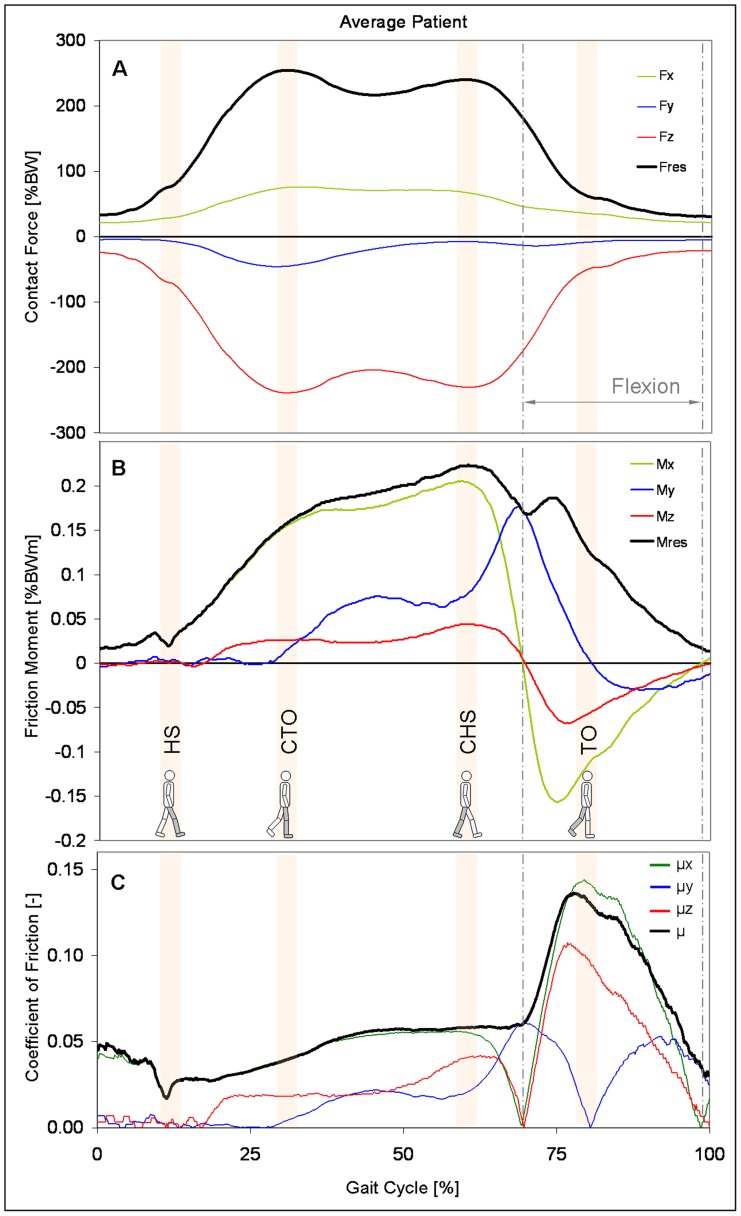
Figure 2. Time courses of contact force, friction moment, and coefficient of friction.
Top: contact force Fres and its components. Middle: friction moment Mres and its components. Bottom: coefficients of friction.µ from 3D calculation; µx (sagittal plane), µy (frontal plane), and µz (horizontal plane) from simplified 2D calculations. The data presented are for an average subject during level walking at approximately 1 m/s. Vertical lines: borders of the flexion phase. The diagram starts before heel strike.

