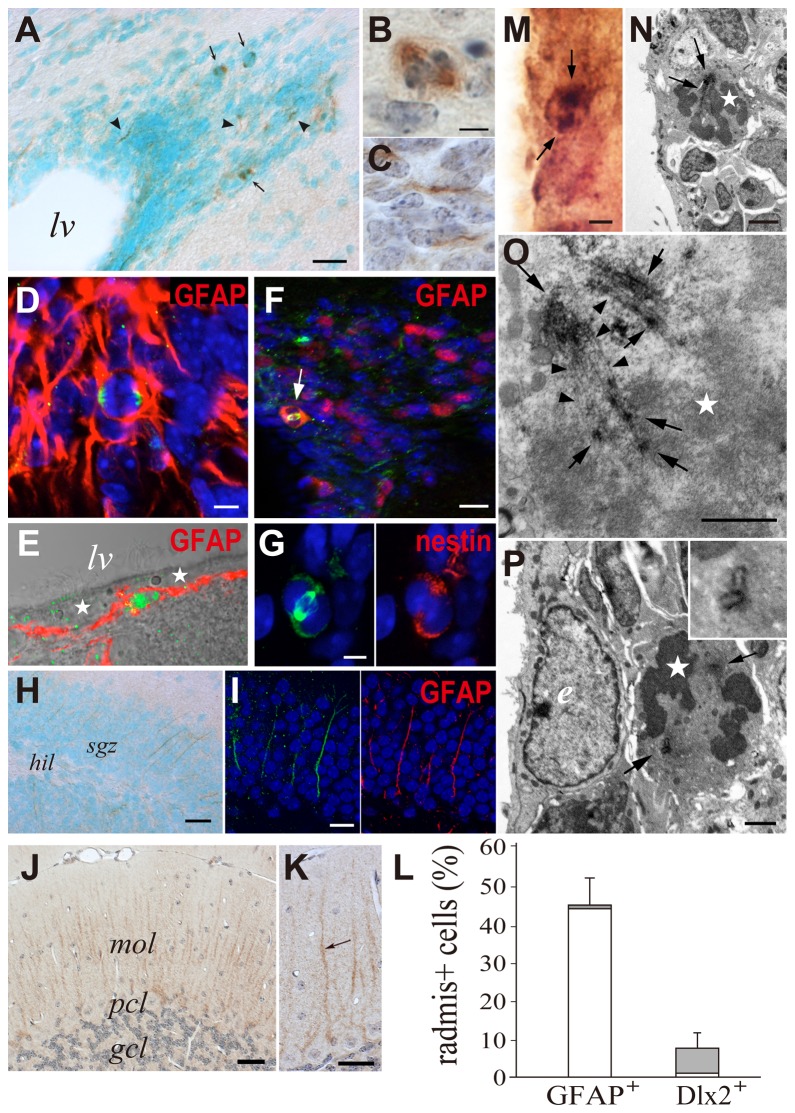
Figure 5. Radmis expression in adult brain.
(A) SVZ region of the forebrain stained with an anti-radmis antibody. Radmis is expressed in a few SVZ cells (brown) surrounding the lateral ventricle. Nuclei are counterstained with methyl green. Radmis immunoreactivity is detected in the mitotic spindles (arrows) of SVZ cells, as well as the fine wavy fibers coursing within the SVZ region (arrowhead). (B, C) Magnified view of each radmis-positive SVZ cell, indicating radmis expression in the mitotic spindle of metaphase (B), and in short wavy processes (C) extending in the SVZ. Nuclei are counterstained with hematoxylin. (D) Dorsolateral corner region of the SVZ stained for GFAP (red) and radmis (green), showing radmis expression in the mitotic spindle of dividing GFAP-positive type-B cells. (E) Lateral wall of the lateral ventricle stained for GFAP (red) and radmis (green). Radmis is expressed in the GFAP-positive astrocyte underneath ciliated ependymal cells (asterisks). (F) Double-immunostaining of the SVZ for radmis (green) and Dlx2 (red). Arrow indicates a radmis- and Dlx2-positive cell. (G) Magnified view of the dividing radmis-positive SVZ cell that simultaneously expresses nestin. (H) Dentate gyrus of the hippocampus. Low level expression of radmis is observed at the cellular processes coursing through the SGZ of the dentate gyrus. (I) Magnified view of the developing dentate gyrus double-immunostained with radmis (green) and GFAP (red). (J) Cerebellum. Radmis is detected in the radially aligned fibers of Bergman glia, albeit at a much lower level. (K) High-power view of Bergman glial fibers (arrow). (L) Quantification of radmis-positive type-B and type-C cells in SVZ region. The number of radmis+ GFAP+ cells or radmis+ Dlx2+ cells were counted in the SVZ region (n = 3 male mice at 8 weeks in age), and the ratio of radmis+ GFAP+ cells / total GFAP+ cells, or radmis+ Dlx2+cells / total Dlx2+ cells were calculated. Solid bars represent the percentage of the radmis+ and phosphoH3+ mitotic cells. Open bars represent the percentage of the radmis+ but phosphoH3- cells. Data were expressed as the mean ± SEM (%). (M–P) Ultrastructural localization of radmis in mitotic cells in the adult SVZ. (M) Optical microscopic image of the SVZ region stained with an anti-radmis antibody. A single neural progenitor cell immunopositive for radmis was visualized by a DAB reaction followed by osmification. Arrows show the radmis-positive mitotic spindle. (N) Electron micrograph of the same section re-embedded and analyzed by EM. Radmis immunoreactivity was detected at the spindle (arrows) of a mitotic progenitor cell, which had condensing chromosomes (asterisk), and contacted with the lateral ventricle with the cytoplasmic protrusion. (O) Higher magnification view of (N), showing the radmis distribution on spindle microtubules (arrowheads). Extensive immunoreactivity of radmis was also detected between each fine microtubule extending parallel to each other (arrows). (P) Electron micrograph of another mitotic cell showing radmis expression in spindle poles (arrows). Inset shows a magnified view of the centrosomes, indicating radmis immunoreactivity on the centrioles. An adjacent ependymal cell that had an electron lucent nucleus (e) was immunonegative for radmis. Scale bars: A, H; 25 μm; B–E, 5 μm; F, 20 μm; G, 2.5 μm; M–N-, 2 μm; O–PM–N, 1 μm; I, 10 μm; J, 50 μm; K, 10 μm. lv, lateral ventricle; mol, molecular layer; pcl, Purkinje cell layer; gcl, granular cell layer; sgz, subgranular zone; hil, hillus.

