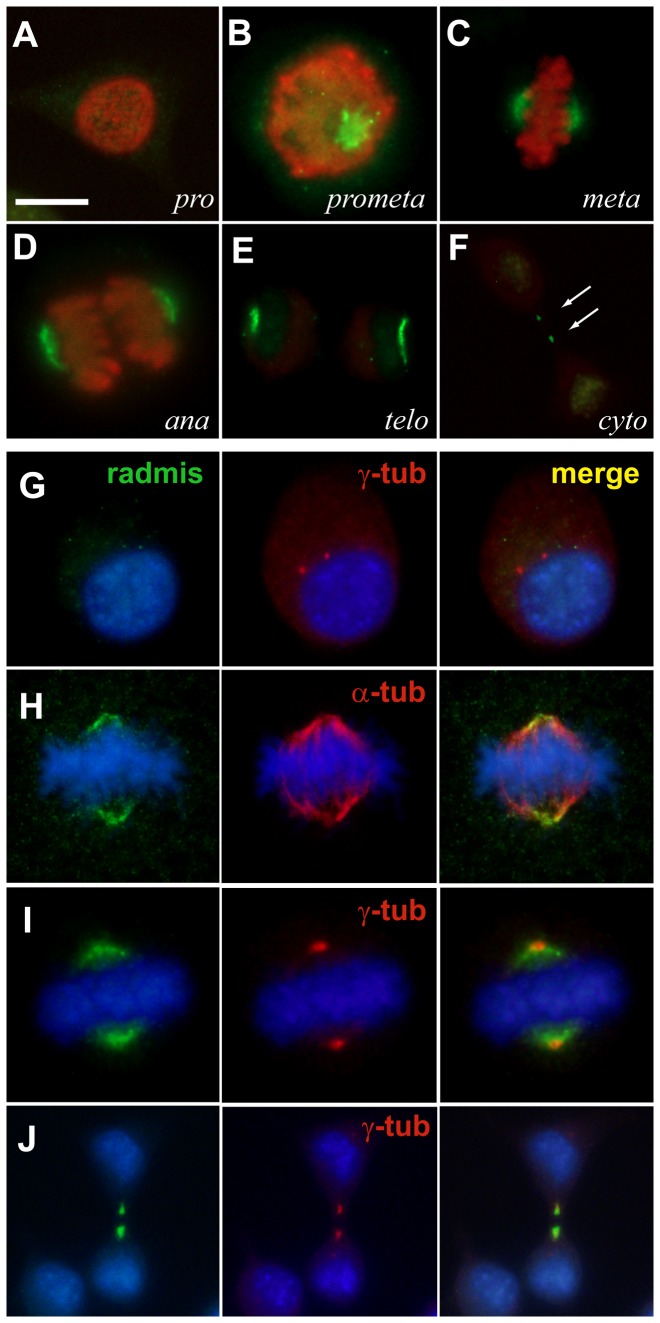
Figure 6. Distribution of radmis during the cell cycle.
(A–F), N2a cells at various stages of mitosis were immunostained for radmis (green) and phosphoH3 (red) to label M phase chromosomes. (A) Prophase. (B) Prometaphase. (C) Metaphase. (D) Anaphase. (E) Telophase and (F) a cell in cytokinesis. Arrows indicate radmis-positive spots of midbodies in the intercellular bridge. (G–J) Cells in each phase of the cell cycle were stained for radmis (green) and α-tubulin or γ-tubulin (red). Hoechst was used to identify cell cycle phases (blue). (G) Interphase cell showing no expression of radmis. (H) Metaphase cell showing an overlapped distribution of radmis with α-tubulin on spindle microtubules. (I) Metaphase cell, showing radmis localization on γ-tubulin-positive centrosomes. Note that radmis is not expressed on centrosomes in interphase cells. (J) Cell undergoing cytokinesis showing colocalization of radmis with γ-tubulin in midbody microtubules. Scale bar: 10 μm.

