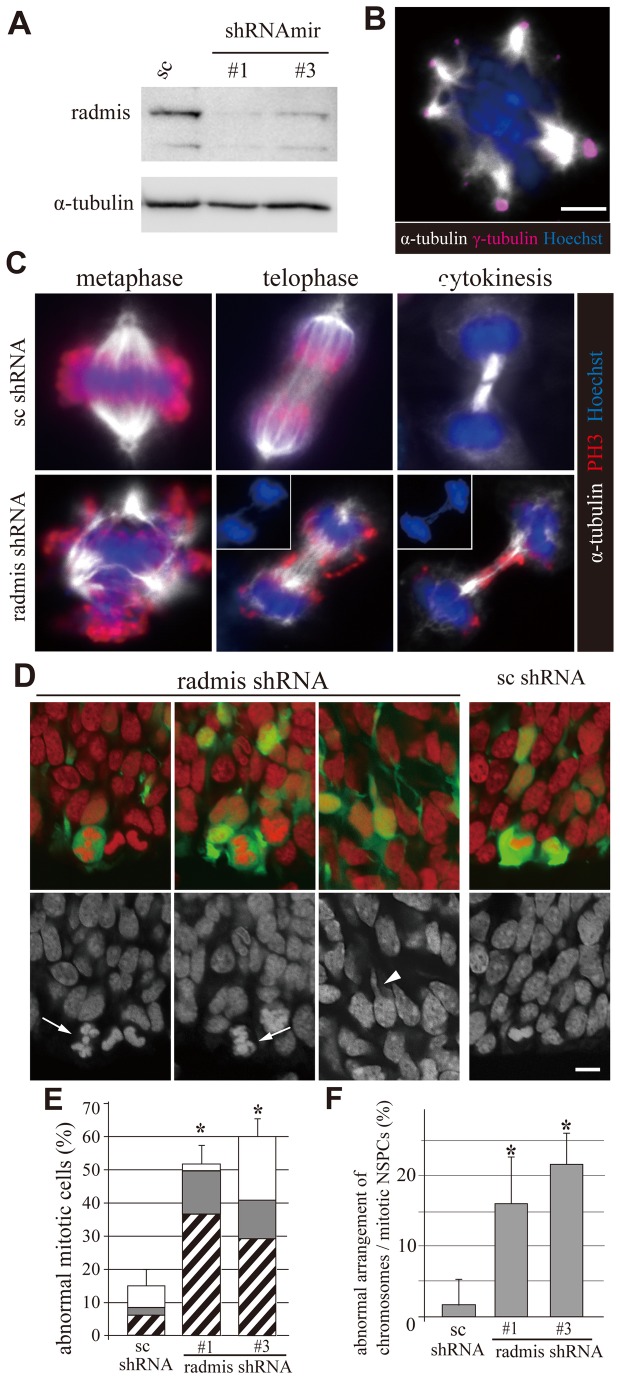
Figure 10. Depletion of radmis induced the multipolar spindles and the catastrophe of chromosome segregation.
(A-C, E) NIH3T3-13C7 cells were treated with EGFP-radmis shRNAmir (shRNA#1 and #3), or scrambled shRNA (control). (A) Immunoblot analysis demonstrating depletion of endogenous radmis at 48 h post-transfection. Total cell extracts were probed with the radmis antibody. Antibody to α-tubulin was used to demonstrate equal loading. (B) Representative image of a multipolar spindle induced by the radmis depletion. Centrosomes were stained with γ-tubulin (magenta), and microtubules were stained with α-tubulin (white). Hoechst DNA staining (blue). (C) Representative images of mitotic cells, showing the failure of chromosome segregation. Upper panels; control cells transfected with scrambled shRNA. Lower panels; cells transfected with radmis shRNA. Left panel; abnormal multiple chromosome configuration. Chromosomes were distorted and moved away from metaphase plate at metaphase, along with the multipolar spindle and irregular distribution of phosphoH3. Right two panels; abnormal chromosome bridge with the ectopically emerged phosphoH3 in telophase and cytokinesis. Insets; DNA staining, denoting the ectopically extending chromatid between daughter nuclei. α-tubulin (white), phosphoH3 (red), and DNA staining (blue). (D) Radmis loss of function in vivo. EGFP-tagged shRNAmir constructs were electroporated in utero into the NSPCs at E13.5, and analyzed 24 h later. Representative images of radmis depleted cells. Arrows indicate the abnormal chromosome organization in mitotic NSPCs. Arrowhead shows the neuron migrating in intermediate zone, which has a distorted nuclear protrusion toward the cortical surface. Electroporated cells with shRNA (green), and DNA staining with PI (red). (E) Quantification of mitotic cells exhibiting abnormal chromosome arrangement among radmis depleted NIH3T3-13C7 cells. Data are obtained from four independent transfection experiments and presented as means ± SEM (%) (group, mean ± SEM (%), cell number analyzed; shRNA#1, 52.0 ± 4.9*, n = 1321; shRNA#3, 60.4 ± 5.4*, n = 1561; scrambled shRNA, 15.0 ± 5.3, n = 1544).Unpaired t-test; *p < 0.01 vs scrambled shRNA. Hatched bar, cells showing the abnormally branched chromosomes with multipolar spindle at metaphase; closed bar, cells showing chromosome bridge at telophase and cytokinesis; open bar, cells in cytokinesis exhibiting the unequal size and different morphology between two daughter nuclei. (F) Quantification of mitotic cells with the abnormal organization of chromosomes among the shRNA-treated NSPCs undergoing cell division in embryonic VZ/SVZ. Data are presented as the mean ± SEM (%) (group, mean ± SEM (%), animal number analyzed; shRNA#1, 16.4 ± 6.5*, n = 9; shRNA#3, 21.5 ± 4.5*, n = 10; scrambled shRNA, 2.0 ± 4.0, n = 7).Unpaired t-test; *p < 0.01 vs scrambled shRNA. Scale bars: B-C, 10 μm; D, 10 μm.

