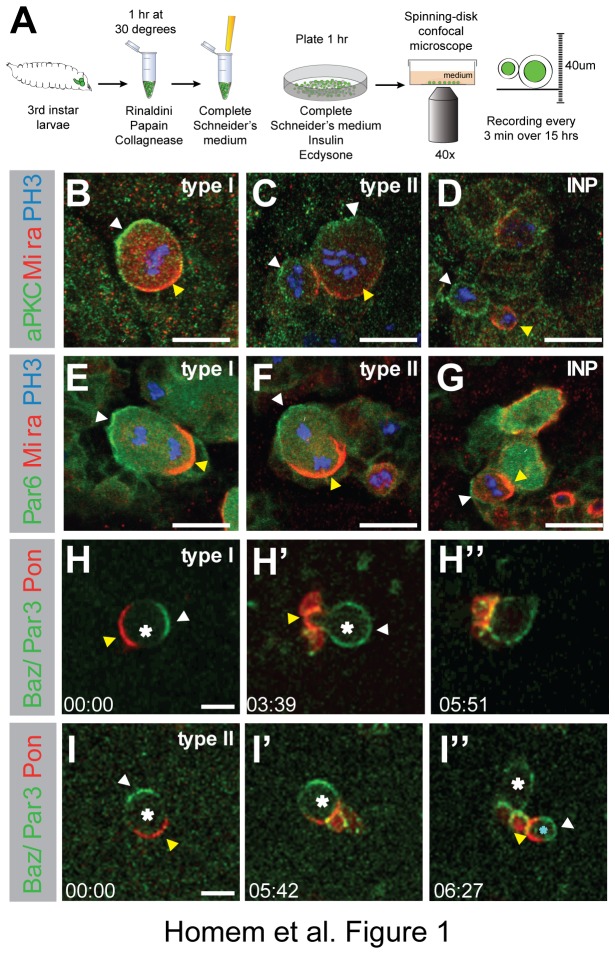
Figure 1. Neuroblasts and INPs divide asymmetrically in culture.
(A) Schematic of the experimental set-up. (B-G) In vivo staining of wild-type 3rd instar larval brains. Type I (B, E), type II NBs (C, F) and INPs (D, G) stained for Mira (red), PH3 (blue) and aPKC (B-D, green). Par 6-GFP (E-G, green) in par 6 mutant background. (H, I) Single frames from cultured NB time-lapse movies. NBs expressing UAS-BazS151A.S1085A::GFP, UAS-mCherry::Pon-LD. White asterisk labels NB, blue asterisk marks INP. (H) Single frames from movie of type I NB undergoing multiple rounds of division in culture. (I) Single frames from movie of type II NBs undergoing multiple rounds of division in culture. Times in hr:min. (A-H) White arrowheads label apical, yellow arrowheads basal polarity domains. Scale bars, 10 µm.

