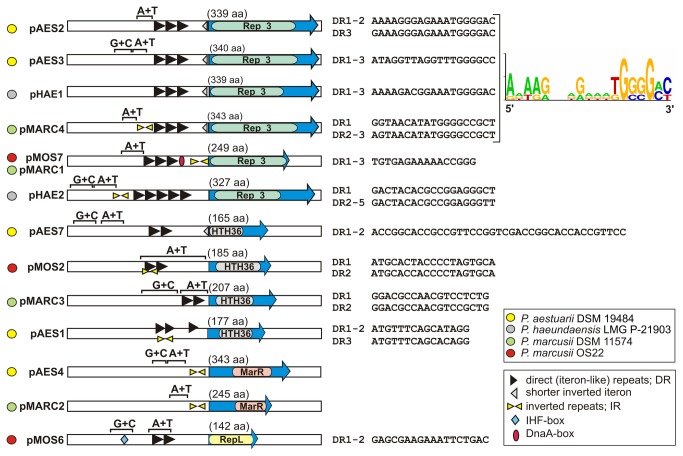
Figure 2. Schematic structure of the REP modules analyzed in this study.
The color-coded keys show the species and strain of origin of each plasmid (circles) and identified direct repeats (DRs), inverted repeats (IRs) as well as predicted DnaA and IHF binding sites (mixed shapes). The sequences of the iteron-like DRs are presented next to the relevant diagrams with a consensus sequence shown for DRs of plasmids with related REP modules. Blue arrows indicate the rep genes and their transcriptional orientation. Specific motifs identified within the aa sequences of the Rep proteins are indicated by colored rounded bars. A+T and G+C indicate DNA regions of lower or higher than average G+C content, respectively. The components of the REP modules are not shown to scale.

