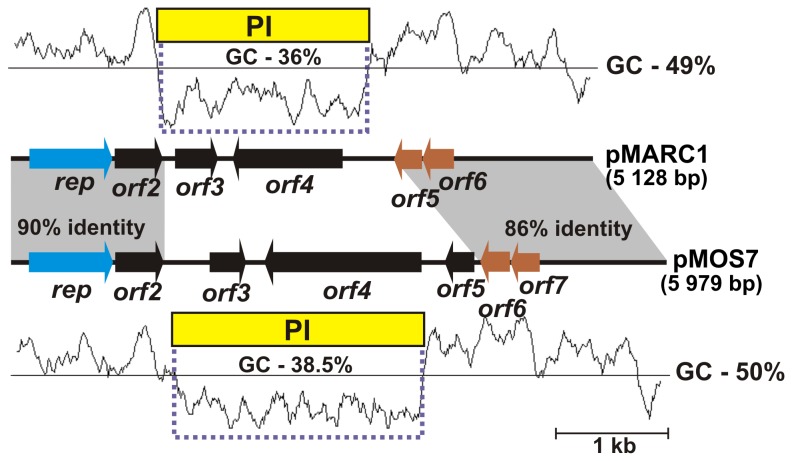
Figure 3. Comparison of the structure and G+C sequence profile of P. marcusii plasmids pMARC1 and pMOS7.
Arrows show the transcriptional orientation of the genes and the color code indicates their predicted functions (as shown in Figure 1). Shaded areas connect homologous DNA regions. The PI regions (with indicated G+C content) are marked by yellow rectangles and dashed lines. The plot shows the G+C content of pMARC1 and pMOS7 sequences (the average values are given to the right).

